|
Here are some screenshots of the VK Callbook Mapper in action. Click a small image to show the full sized image in a new browser-tab. Note that the quality of the .jpg images are not as good as the standard VK Callbook Mapper screen, due to format-coding limitations of the .jpg standard.
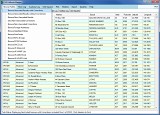 | Here is a view of the callbook, with data as downloaded from the A.C.M.A. and then loaded by the program into its two onboard relational databases. The positions are derived from a separate Suburb/Postcode database. Spelling mistakes are spotted, and can be easily corrected. Foreign addresses are saved separately. 9 additional tables are included, so you can compare position, distance and bearings from any callsign to any other, or to any of the data table entities, or your own lists. |
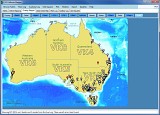 | Three different maps are included. Here we see the Overlay Map, which has 16 unique overlays that can be stacked in any order. The QSOs from one of the logs have been plotted on top. Different marker-colours represent different bands. You can hover over any marker to identify it, or right-click to perform a spatial-query against any other QSO, or any other entity in the 9 included data-tables, or your own lists. |
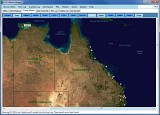 | Another view of the Overlay Map, here showing a log plotted over the Blue Marble cloudless satellite photo. Other overlays include a view of Australia at night, a relief map, plus time zones, CQ or ITU zones, Grid-Locator and LatLon overlays, plus names, states, prefixes, and even flags. Major cities can be turned on and off or you can plot any city, town, or hamlet from the included Gazetteer of nearly 18,000 entries. It even includes Cook, which has a population of just 4 people! |
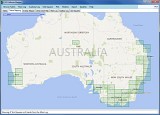 | The Online Map can use a number of different map-providers to show your data. Here we see a Bing map, with unique Grid-Squares from the Main Log plotted over it. The square over Alice Springs has the cursor hovering over it, so it is identified by an adjacent label. Normally that label shows the lat/lon position of the mouse cursor. |
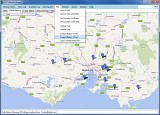 | The ContestRadar.com website shows the operating positions of current mobile and portable contest or special-event stations. Their website lets you plot the entries on a map, but here you can do the same, plus perform spatial queries to get the distance and bearing of every other station on the website, as well as reference their positions to the other data tables in the VK Callbook Mapper: very handy to find the nearest towns, or SOTA or WWFF entities. |
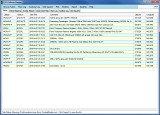 | In addition to plotting the ContestRadar positions on the Overlay or Online Maps, you can show the data in a table, where it can be sorted or spatially queried to reference any position to any other in the table, or in any of the included databases. |
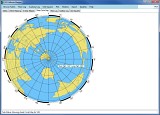 | A Great Circle Map is always useful when pointing a yagi or other directional antenna. The VK Callbook Mapper is supplied with maps centered on VK1-8 call areas, or you can even add a Custom map centered on any location for an extra 5 AUD. |
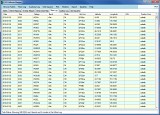 | The VK Callbook Mapper provides facilities to keep 2 logs in the databases. They can be sorted by mode or band, and plotted in a number of different ways on the Online and Overlay Maps. If the logs have no included positions, they can be geocoded from the internal database. You can also extract positions from included ADIF tags, Grid-Locator entries, and even Cabrillo contest exchanges. |
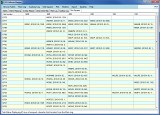 | The Main Log is automatically checked for unique Grid Squares, which are laid out in their own table for easy reference, where the squares can be sorted and plotted on the maps by band or QSL status. You can also check how many times a specified square has been contacted, and select QSOs from the specifed square to be plotted on the maps as markers. |
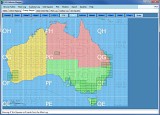 | Grid Squares from the Main Log are stored in their own table, for easy access. This is a great way of keeping a permanent record for Grid Square hunters. When plotted on the map, they can be easily identified, so you can soon see which squares are missing from your collection. You can also spatially query the callbook to find which calls are located within any missing Grid Square. Why not drop them a line and arrange a QSO? |
 | Two windows are shown here: the Options window and the About window. There are many program settings that can be changed in the comprehensive Options window. Here we see the first tab, where you enter your home QTH details, which are then used to perform spatial queries against any other entity in the databases. |
|