Here are some screenshots from the latest incarnation of the Global Overlay Mapper. Click any image to show that full sized image in a new browser-tab.
The Global Overlay Mapper has come along way since the first release and ARRL QST review in 2006. The original set of 7 continental and 30 sub-continental maps have been expanded to include a large World Map, suitable for today's large screen monitors as well as many other unique mapping tools, turning the Global Overlay Mapper into a modern 'Swiss Army Knife' for Amateur Radio DXers and Contest Operators.
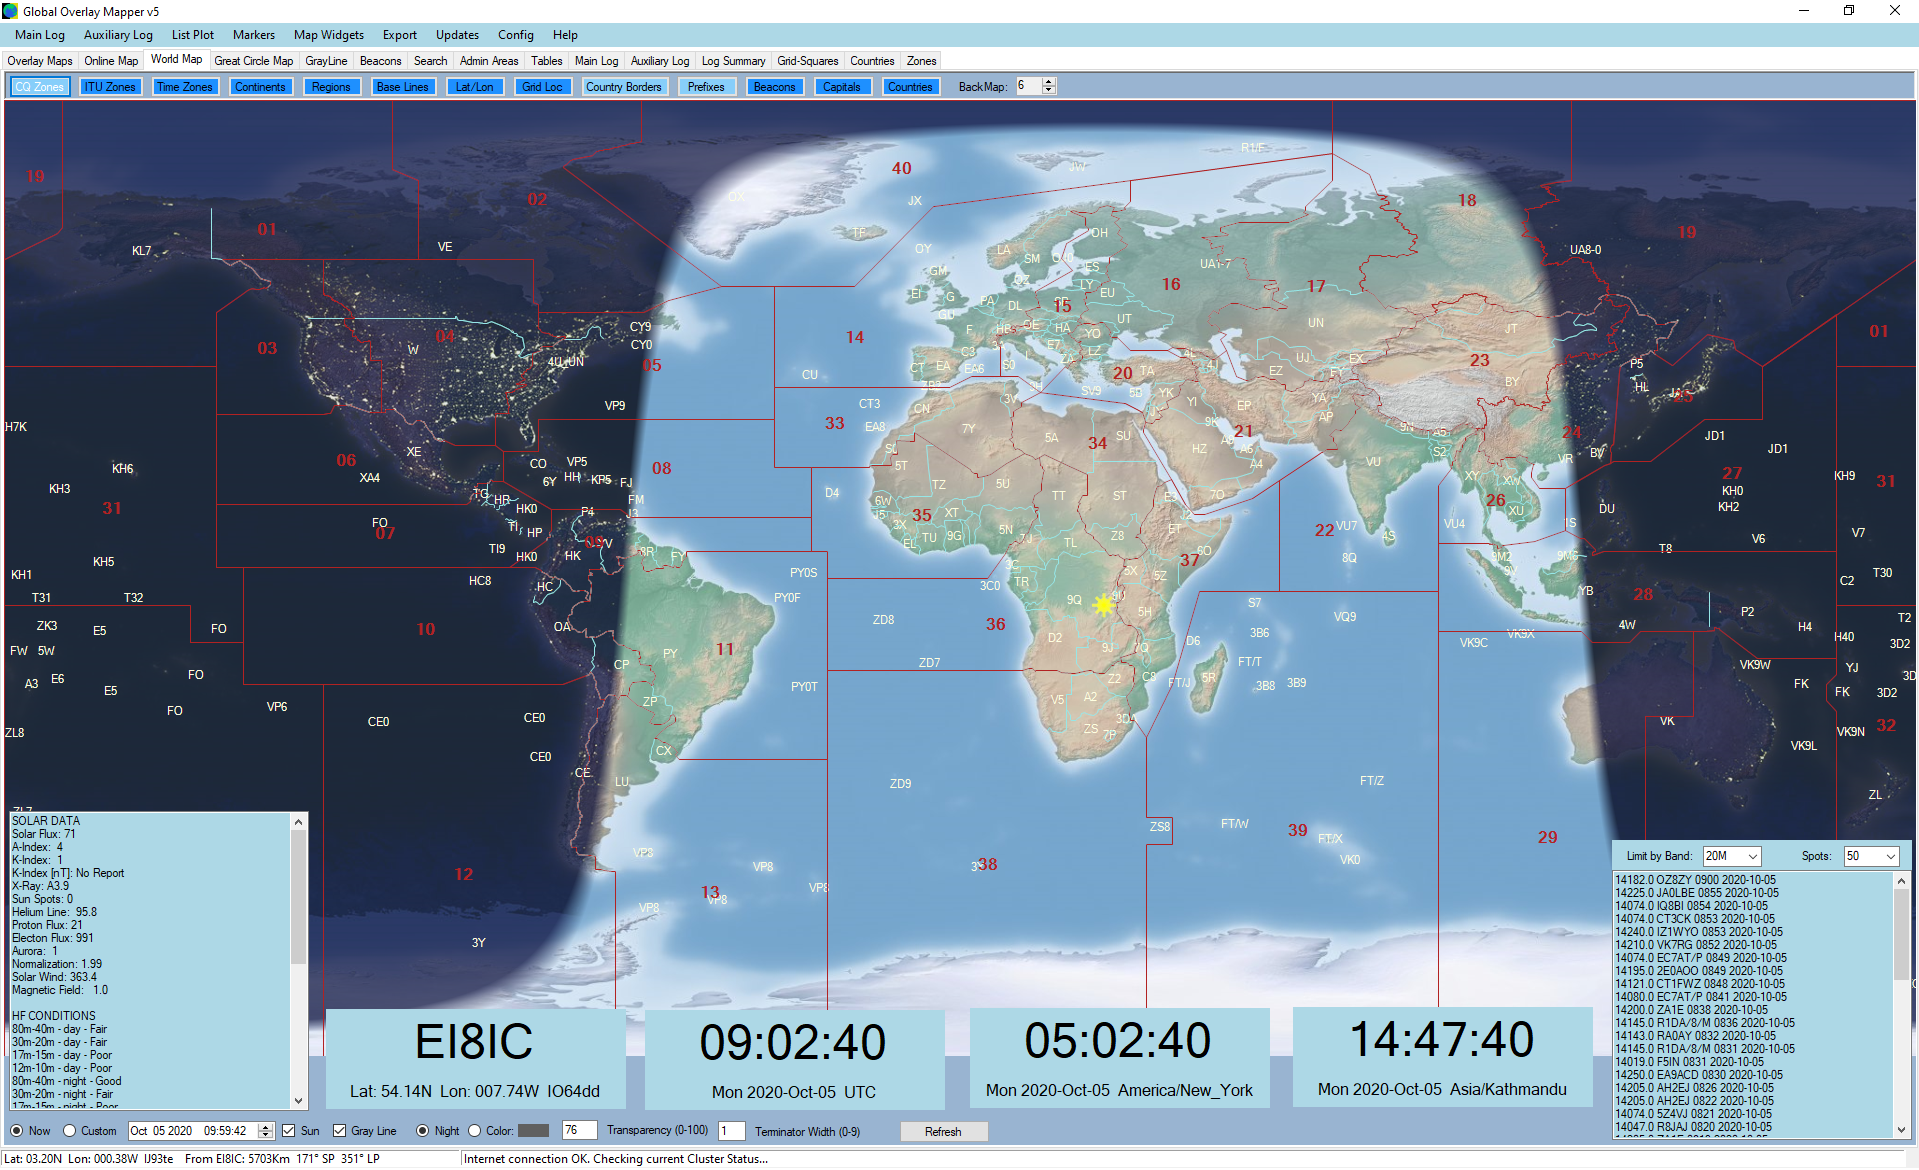
Here is the latest World Map, with one of its 15 available background images. The Gray Line facility is turned on, to show the current Daylight/Darkness Terminator. The CQ Zones overlay has been added, with Country Borders and Prefixes. Mouseover a prefix for further information. All the Map Widgets are turned on: the gray boxes along the bottom of the map can be dragged anywhere on the screen, and are fully configurable. Changing a clock's timezone is as simple as right-clicking a point on the map. |
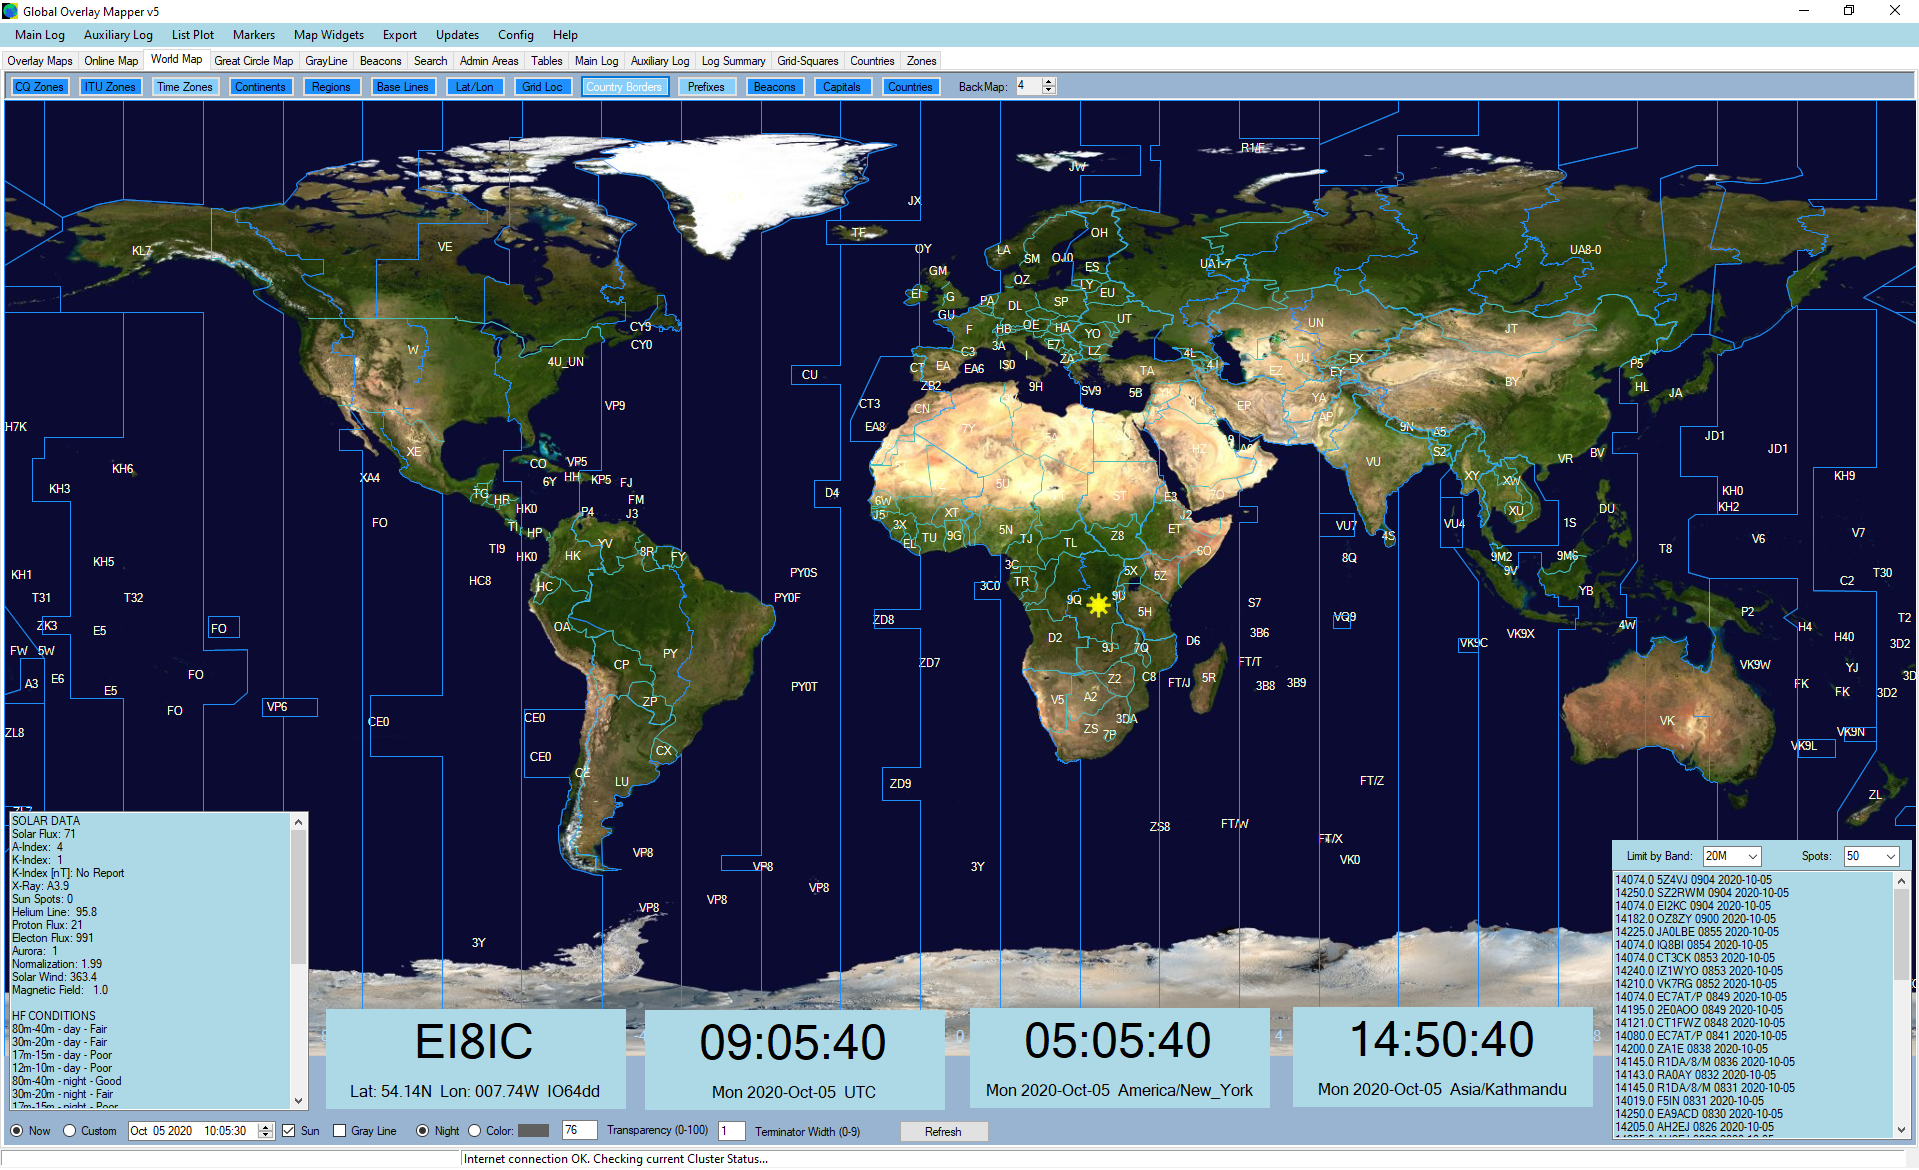
Another World Map background, with added Time Zones, Country Borders and Prefixes. You can click at any point on the screen to get full solar and timezone information for that point. |
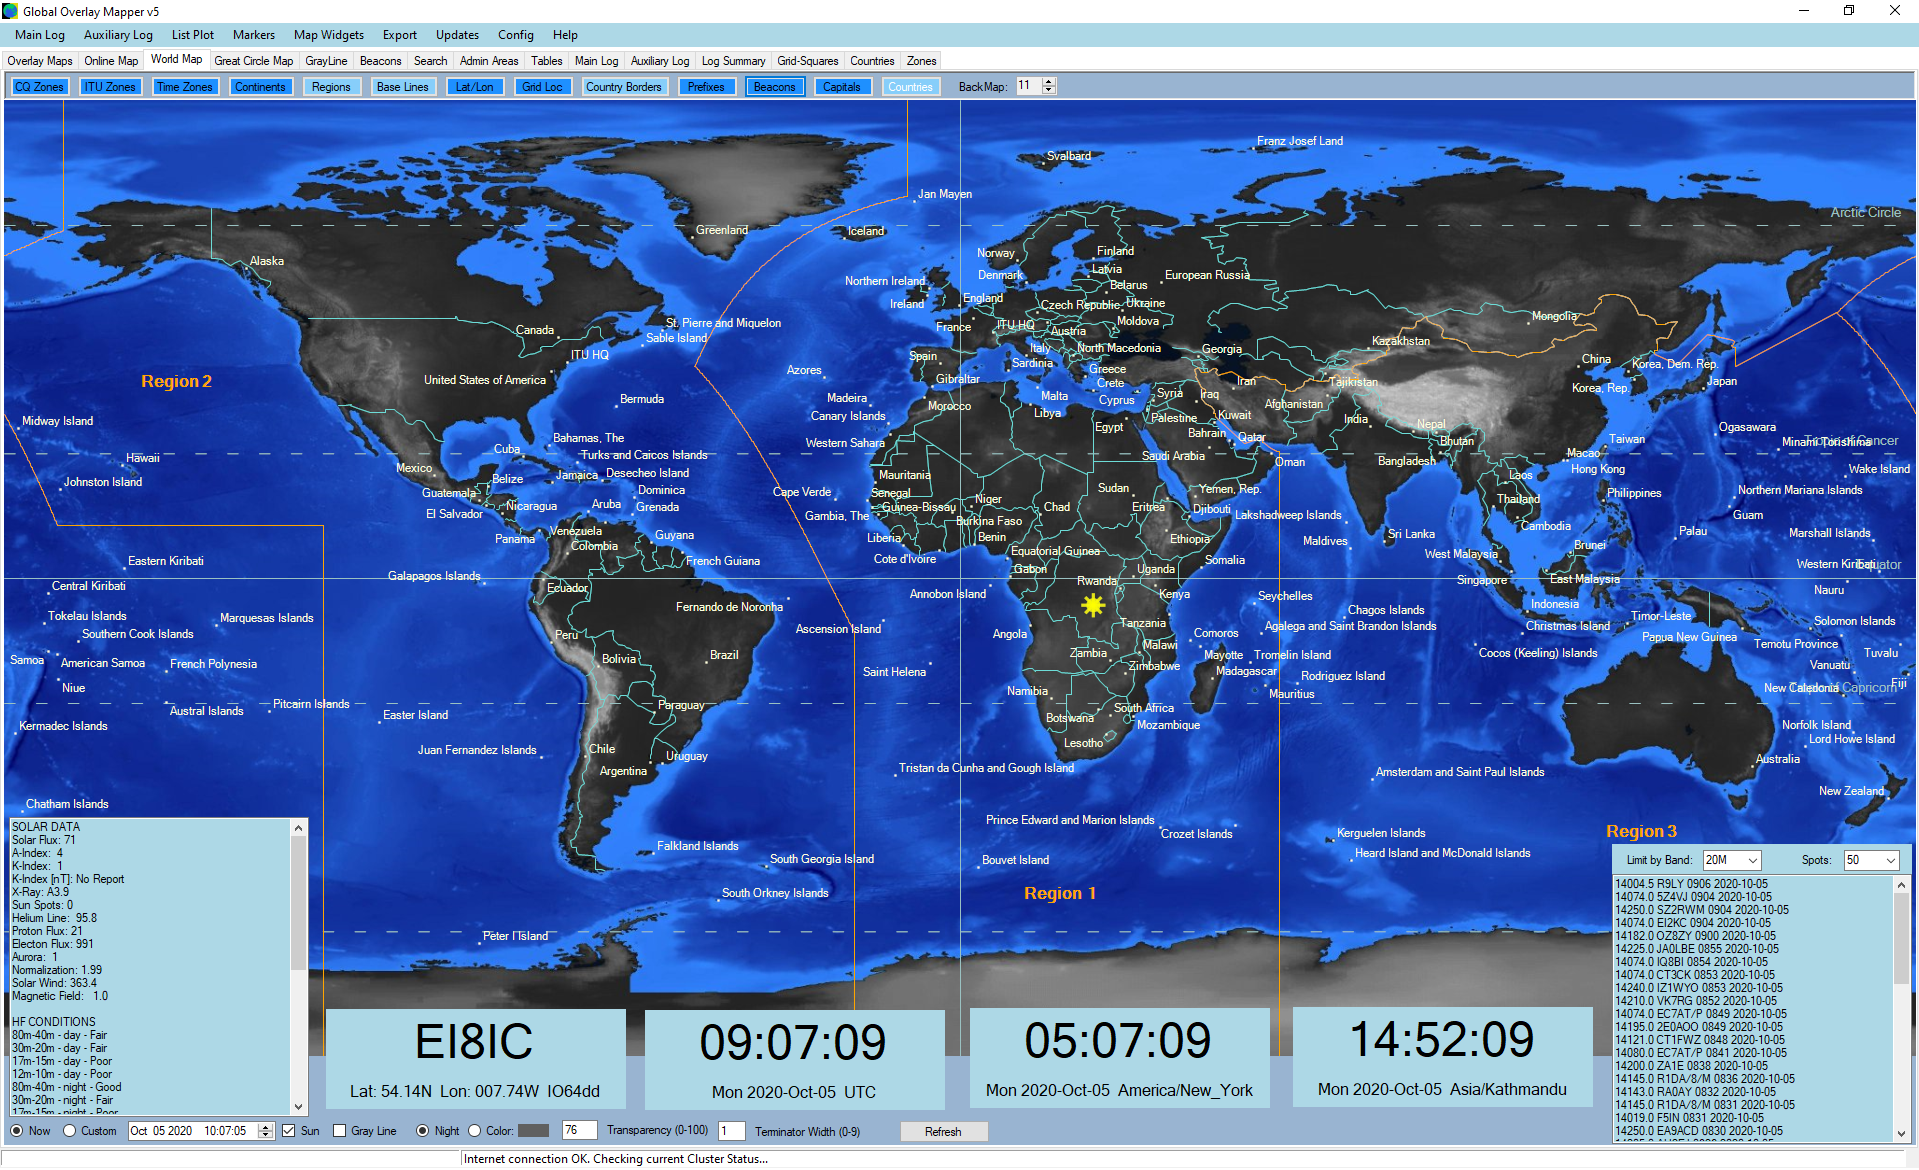
An alternative view, with IARU Regions, Base Lines, and Country Names. All overlay colors and fonts are fully configurable to suit whatever sized screen you are using. The map labels automatically adjust for font-size, and more labels will appear on a larger monitor. |
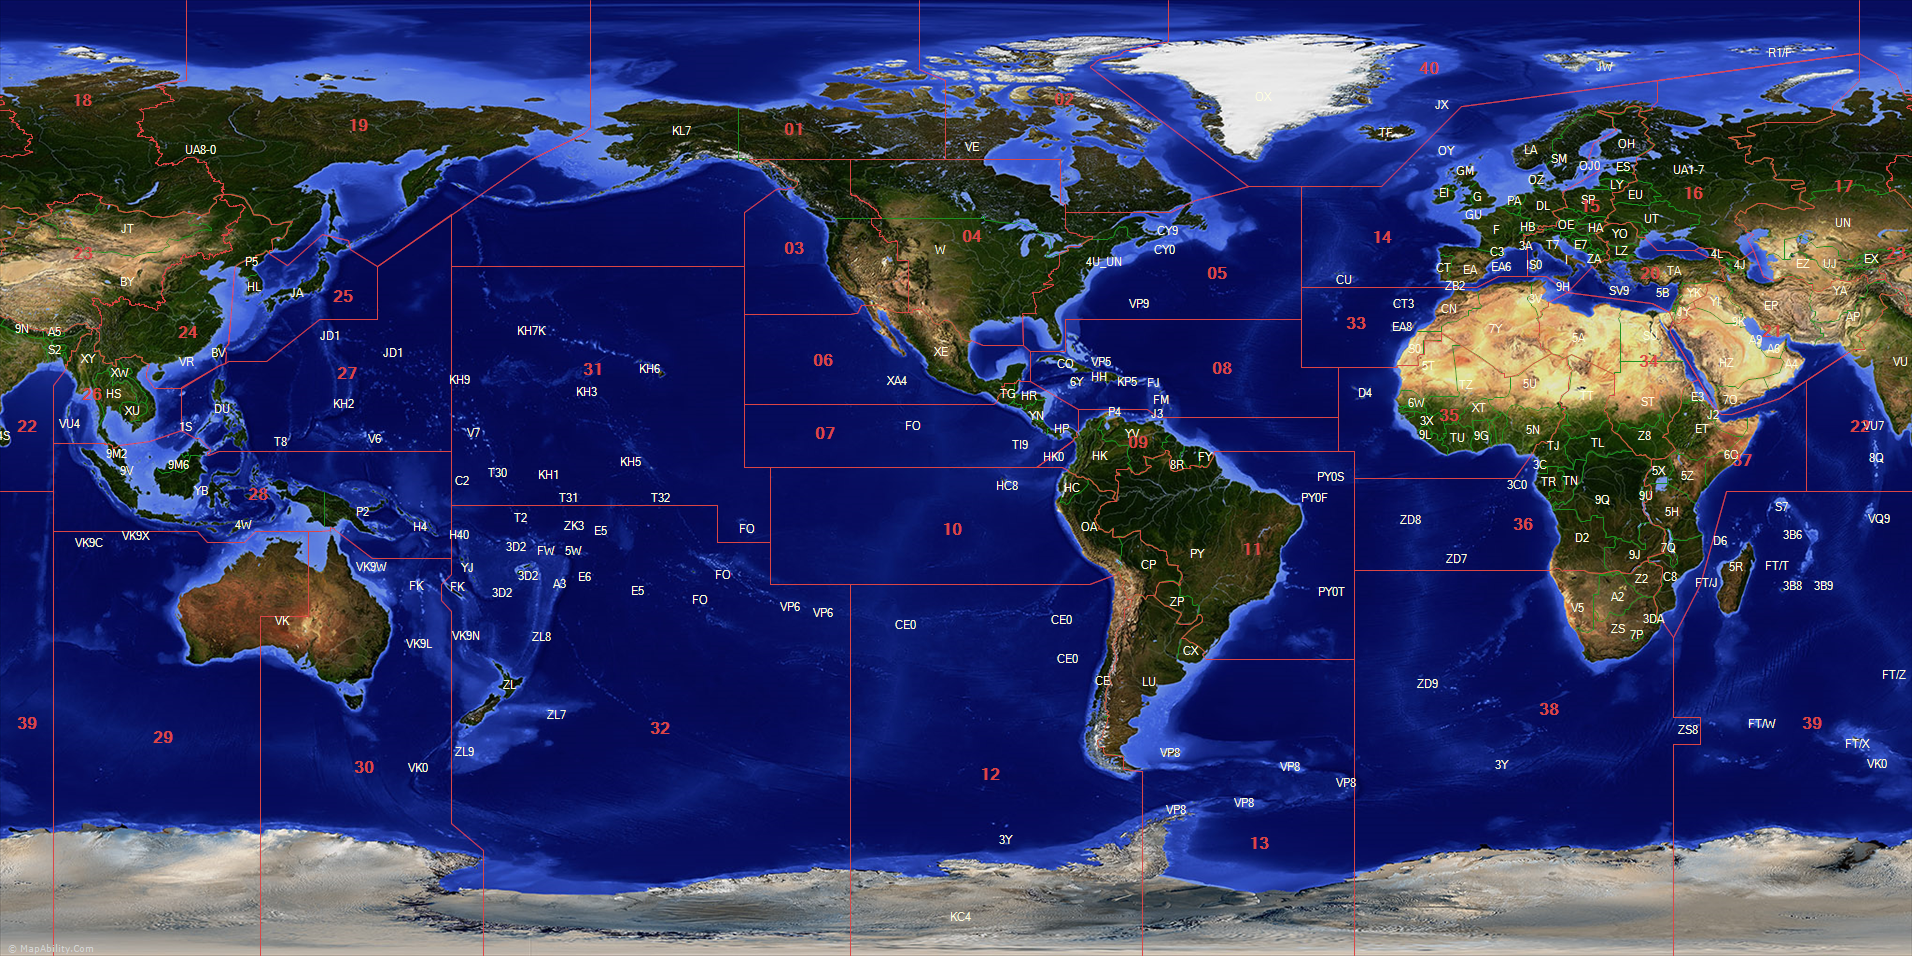
Not everyone lives in London, Valencia or Accra, so why are maps always centered on the Greenwich Meridian? The Global Overlay Mapper lets you define any center-position on the seamless World Map and its Overlays. You can also set the default Longitude value for the map at program-startup. |
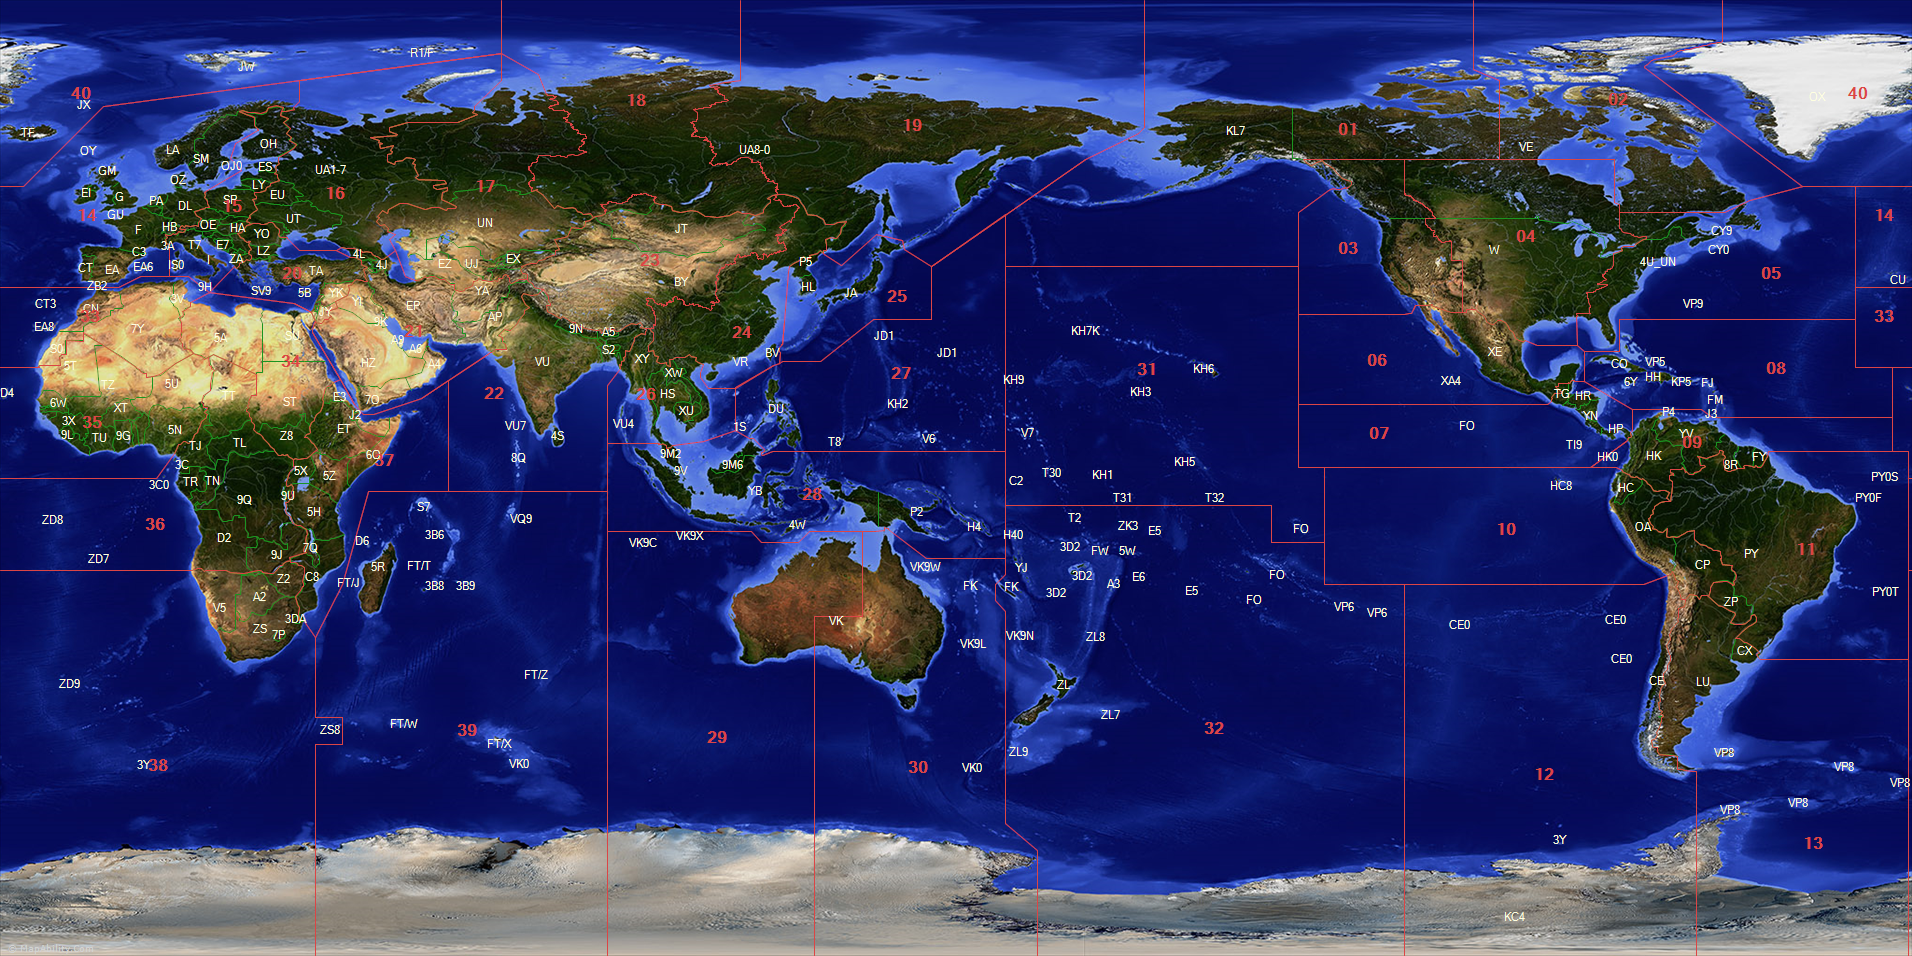
It must be very annoying to live in VK/ZL land, and always find yourself squashed on the edge of the map. That's no longer the case: position yourself in the map center, and plot prefixes and seamless zones on either side of your QTH. |
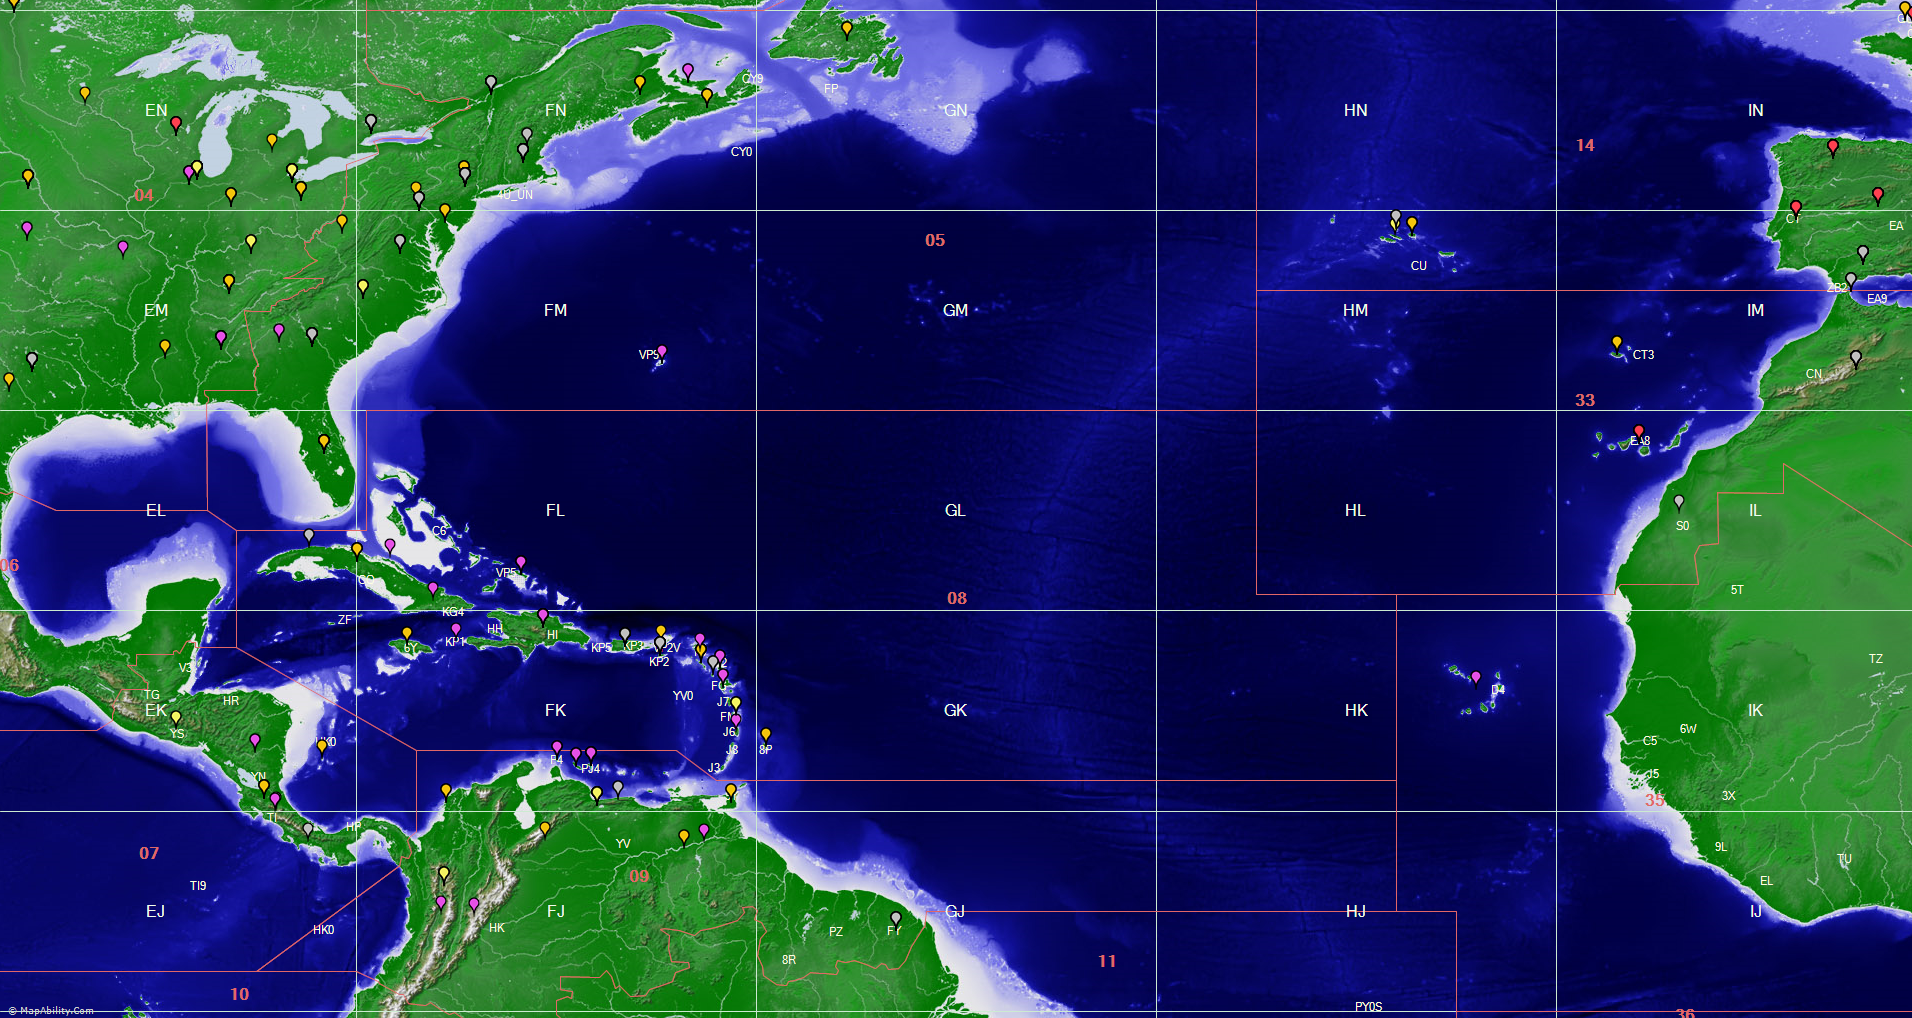
The Global Overlay Mapper's World Map now includes four levels of Zoom, for each of the 23 background maps. Here we see a zoom-in to the Caribbean, with the CQ Zone, Grid Locator, and Prefix Overlay's added. We have then plotted the callsigns in one of the two logs. The different colors refer to the different bands in the log. Hover over any marker for additional information and other map-features. |
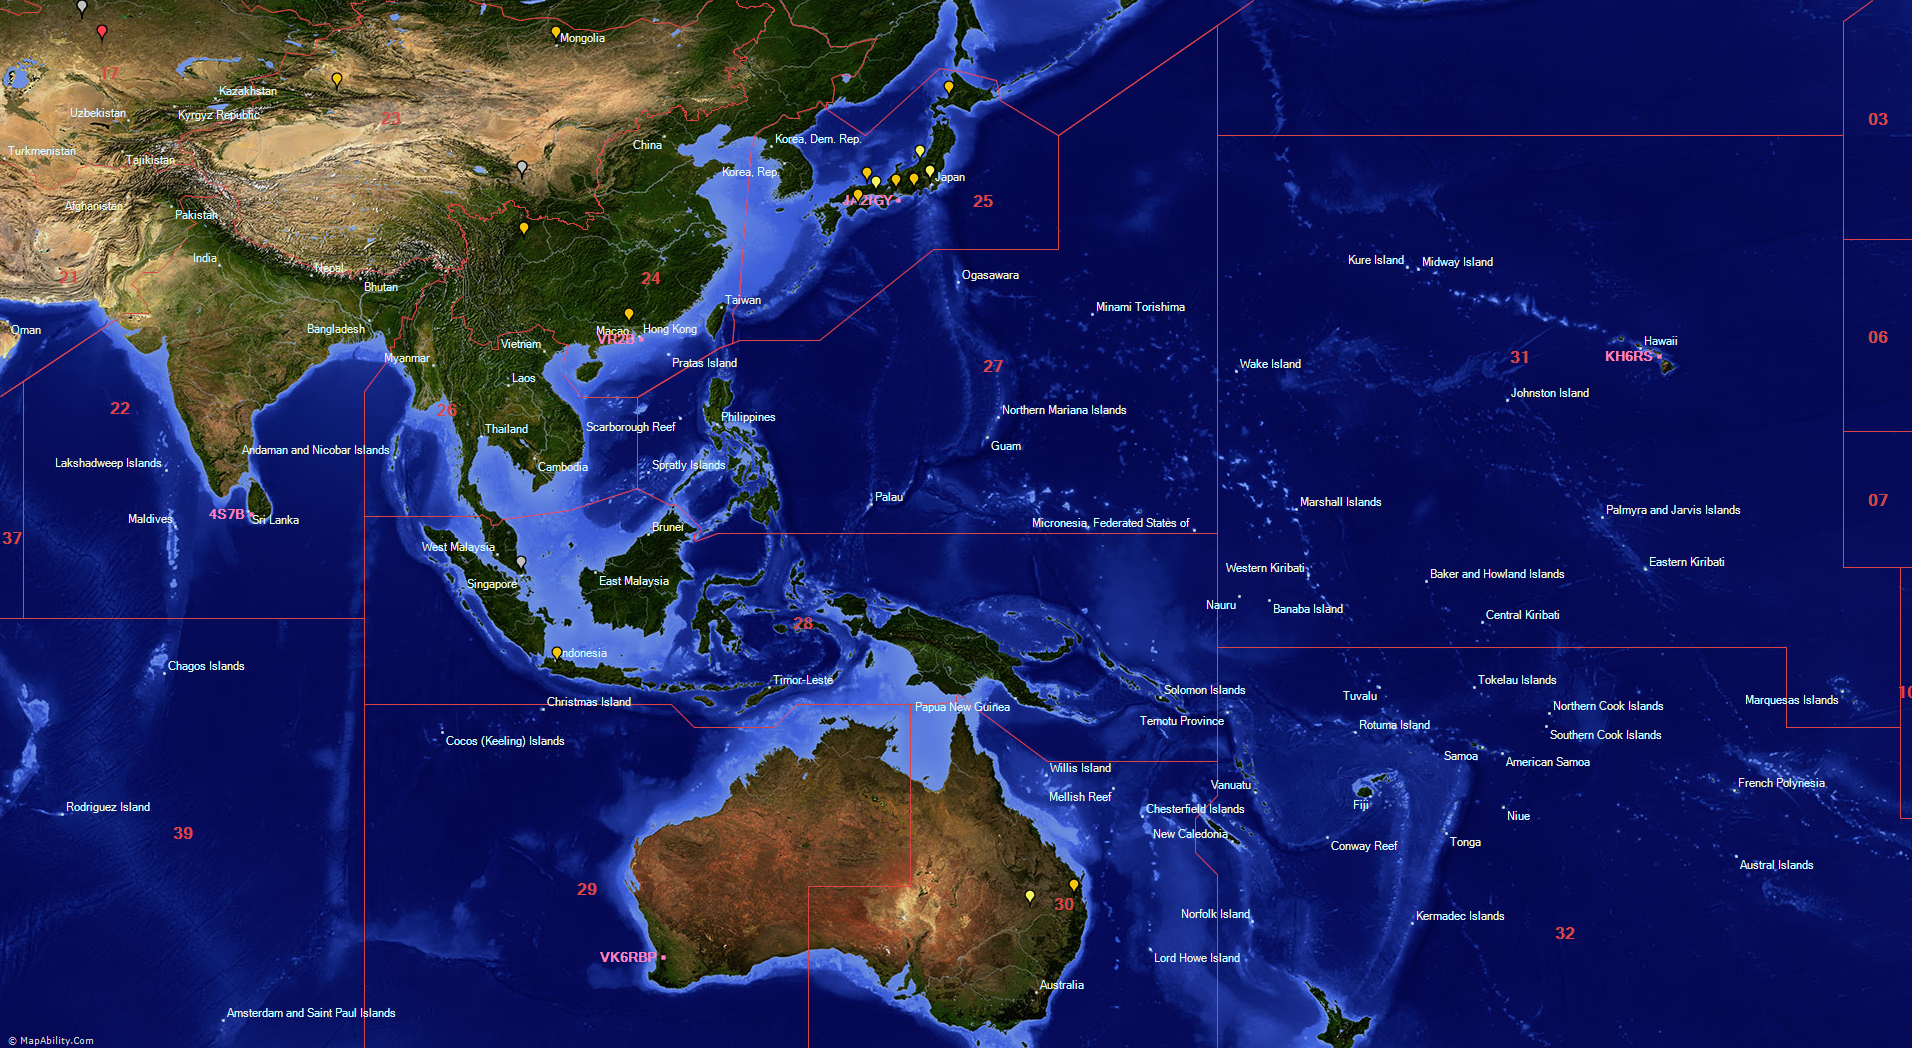
A lot of work has been put into the seamless maps, which are some of the most attractive available for the Radio Amateur community. New label plotting routines mean that Labels within an overlay do not over write each other, and the more you zoom in, the more labels you will see. |
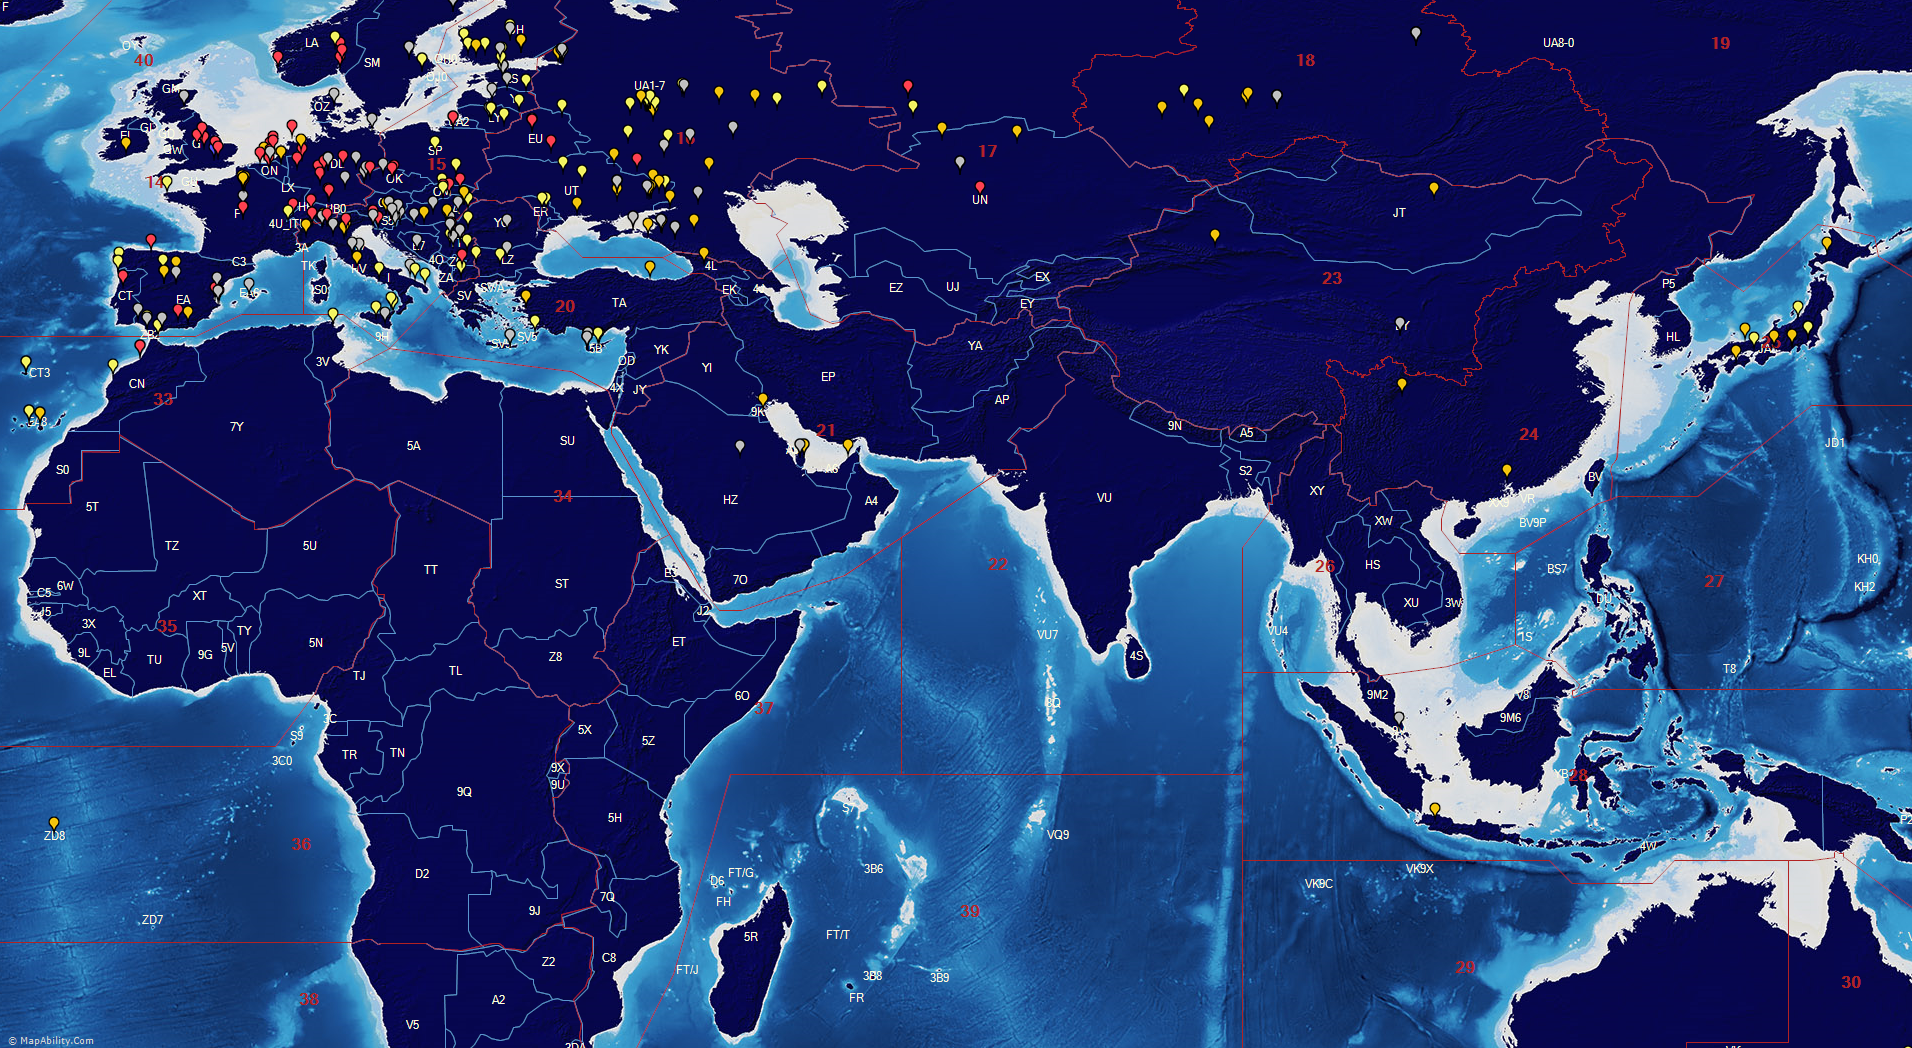
There are twenty three background maps available, in three different sizes. You can swap between them very easily, and adjust the color and font of each Overlay, which is saved separately for each of the twenty three backgrounds. |
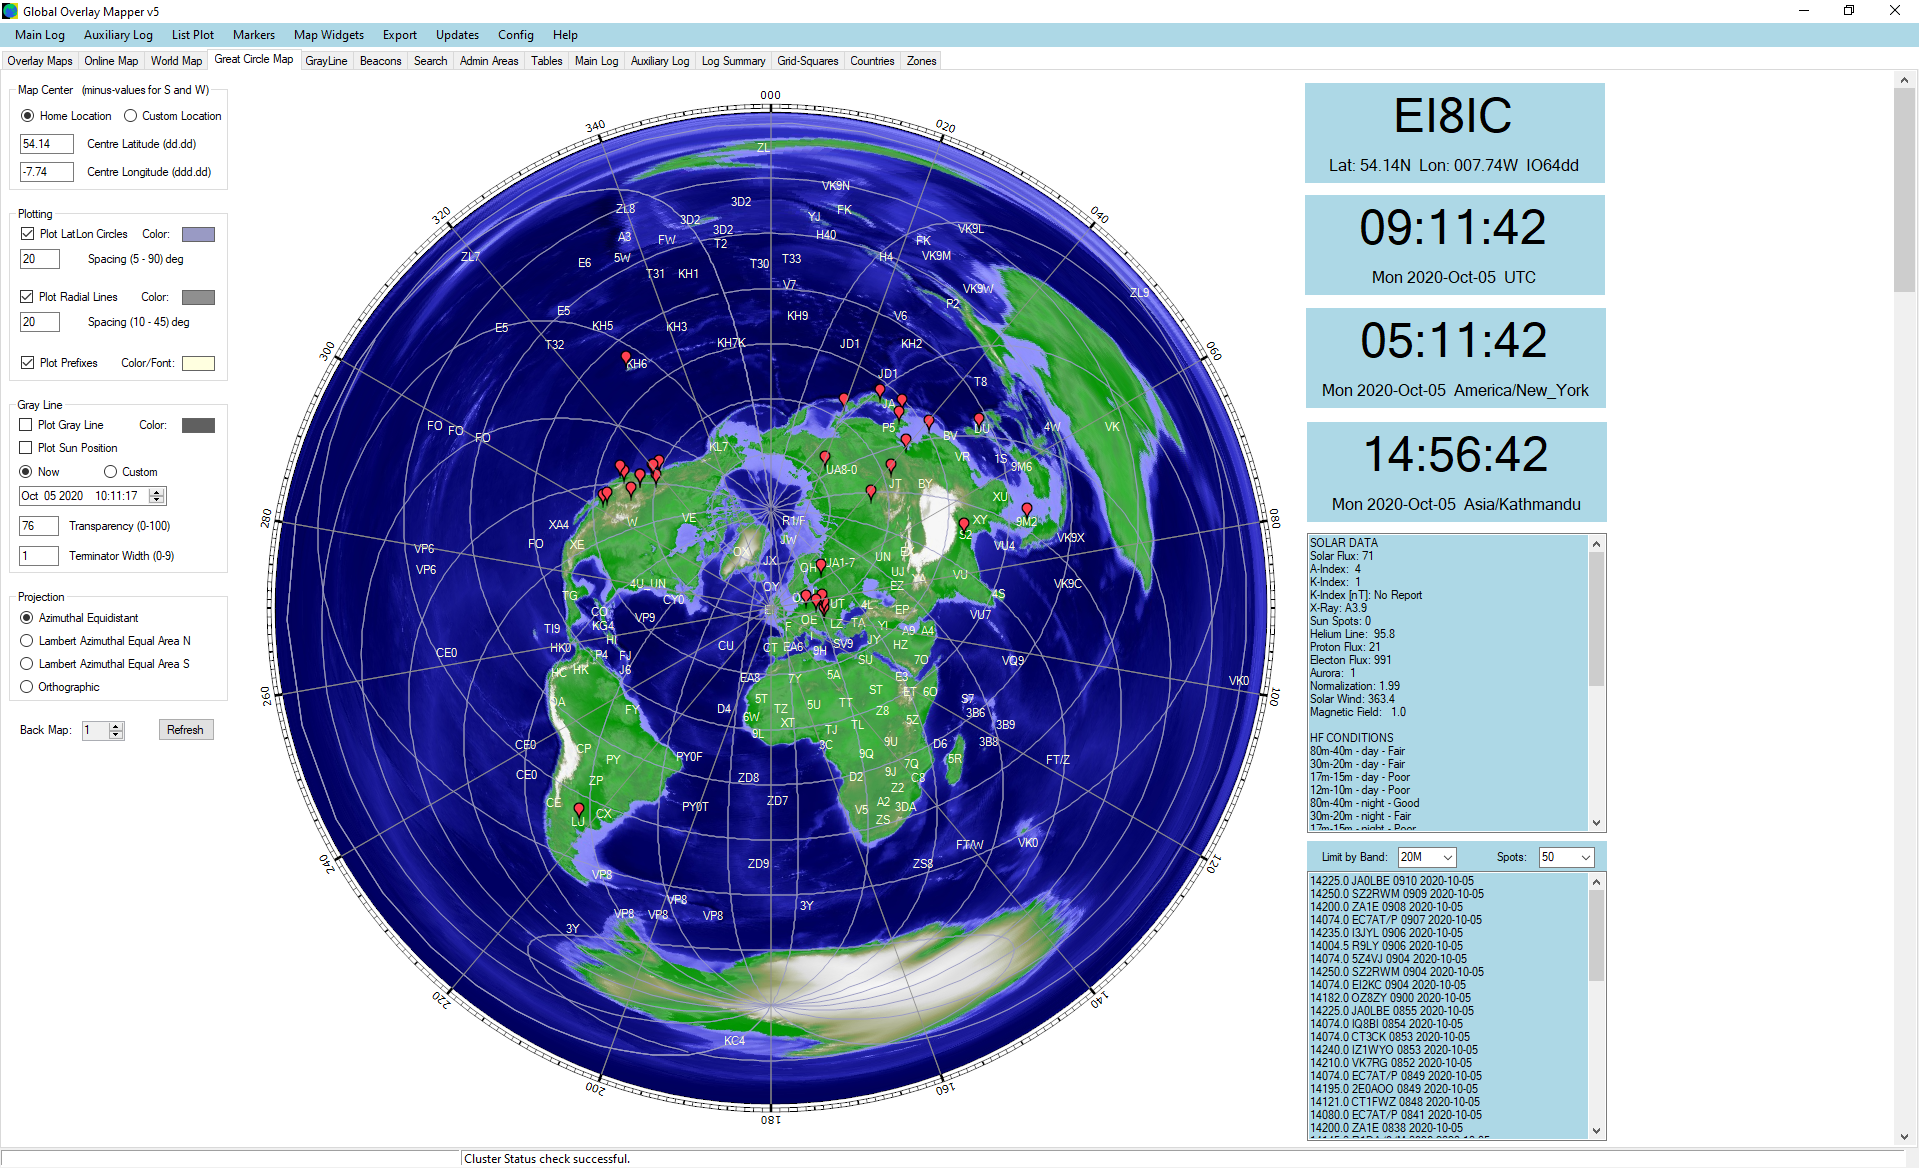
There are plenty of programs that show the ever useful Great Circle Map, but there are none so attractive or so versatile as the Global Overlay Mapper v5. Choose from 15 different backgrounds, 4 different projections, prefix plotting, QSO plotting, re-center on click, Gray Line for any date or time, Map Widgets, plus individual colors and fonts saved for each background. |
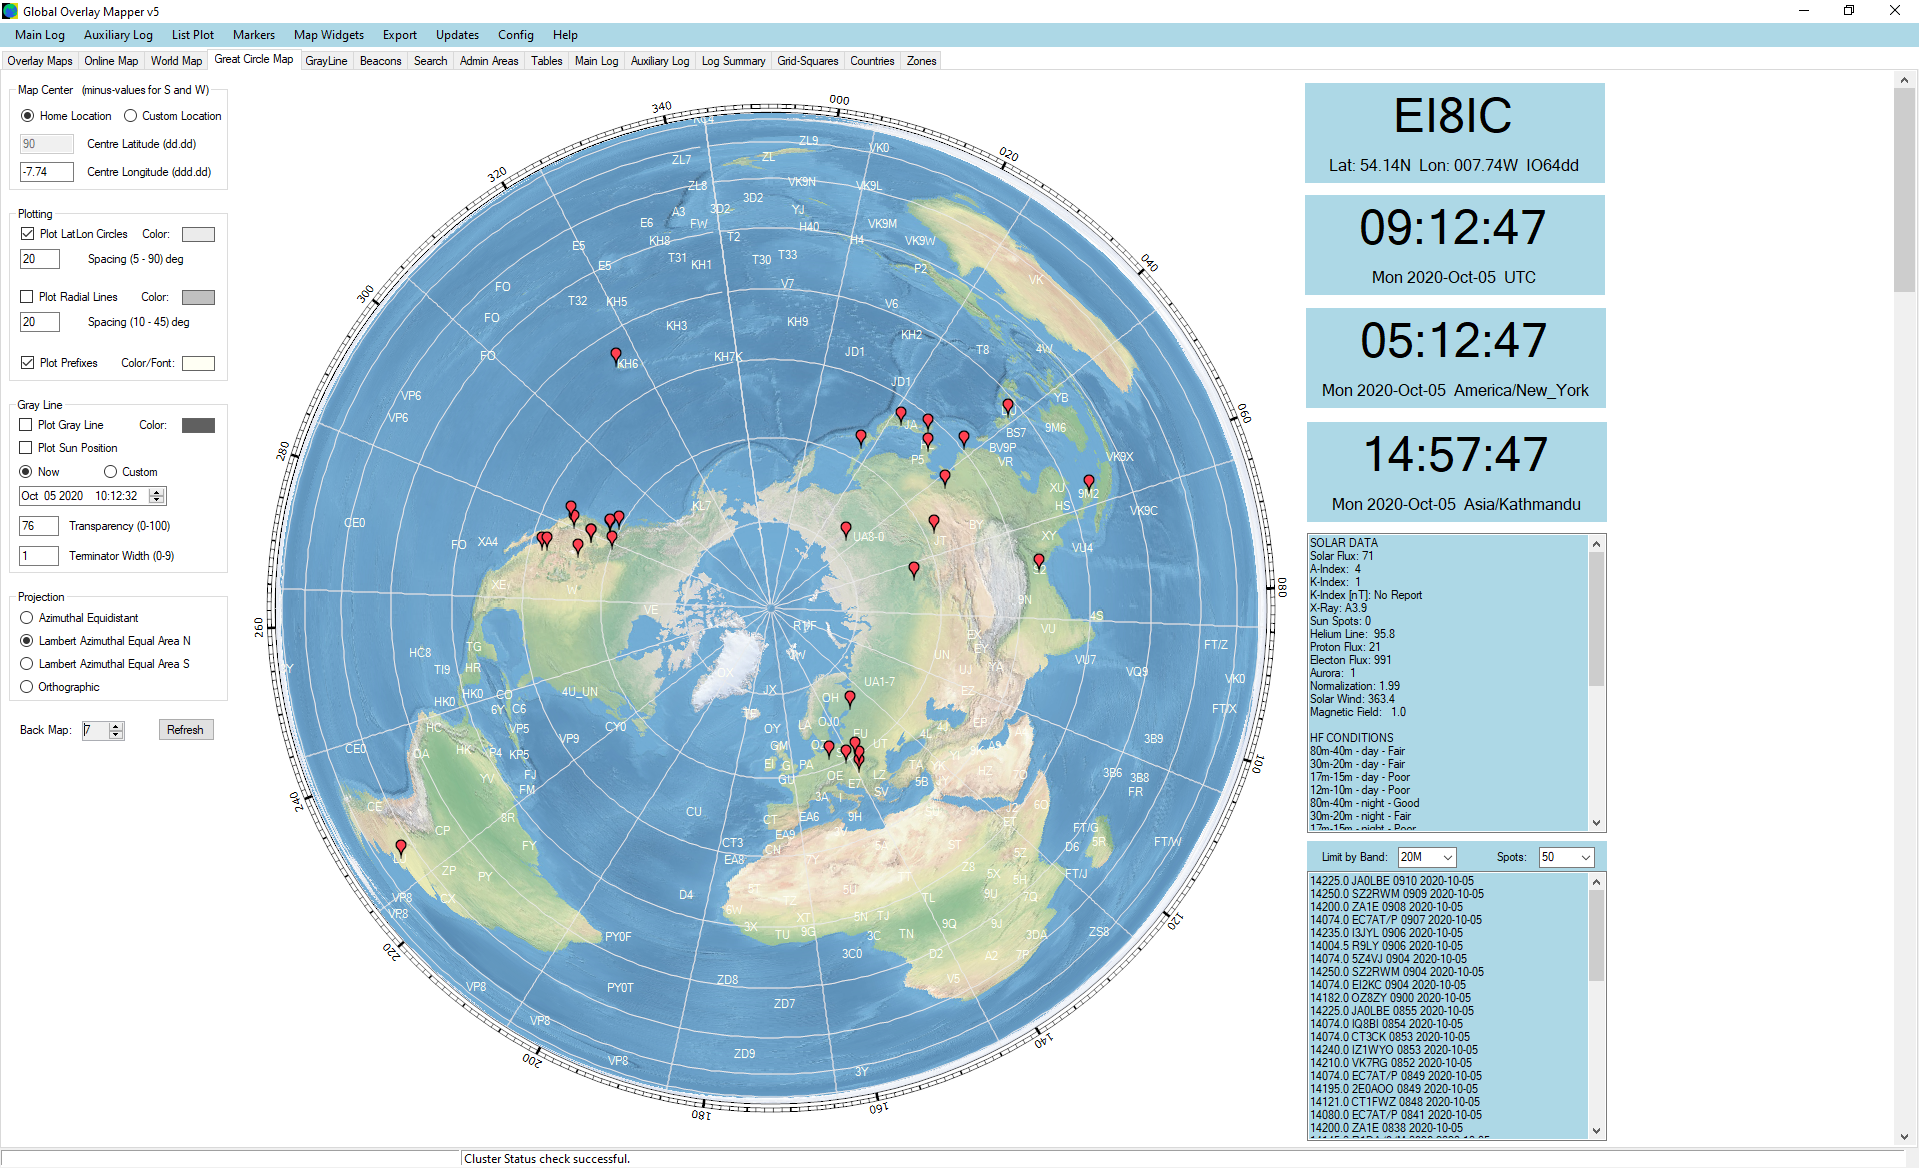
A different background map, and the projection now shows Lambert Azimuthal Equal Area, centered on the North Pole. The Global Overlay Mapper uses 5 different projections: all are explained in the comprehensive Help Guide. Those red markers on the map show QSOs from one band, plotted from the Main Log. You can import ADIF or Cabrillo logs, and geocode them from the HamQTH online Server. |
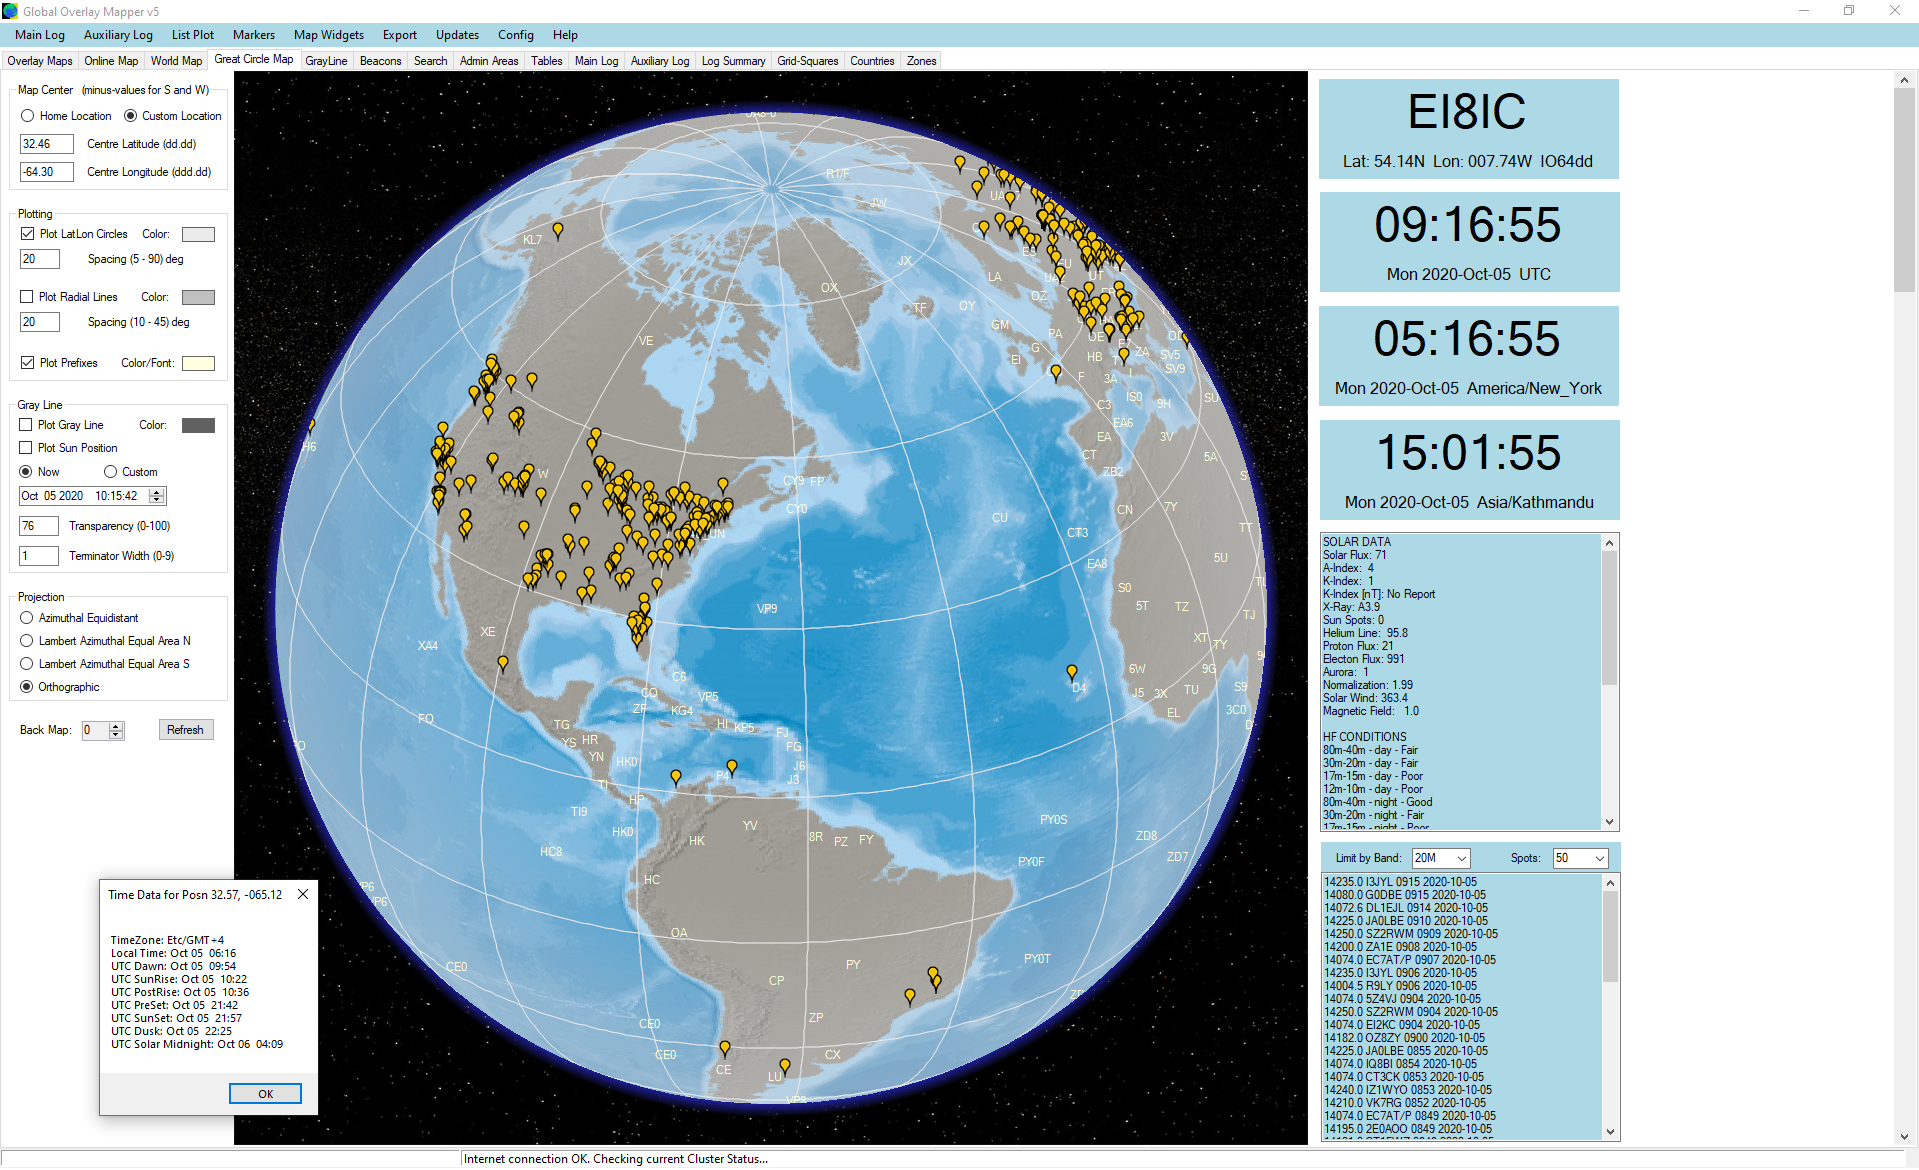
The Orthographic projection is often thought of as 'The World From Space'. You can click anywhere on the map to recenter it, or right-click to get the solar and timezone data for that position: an example is shown in the box at the bottom left. Mouseover any prefix to show additional information. Add Map Widgets as required. |
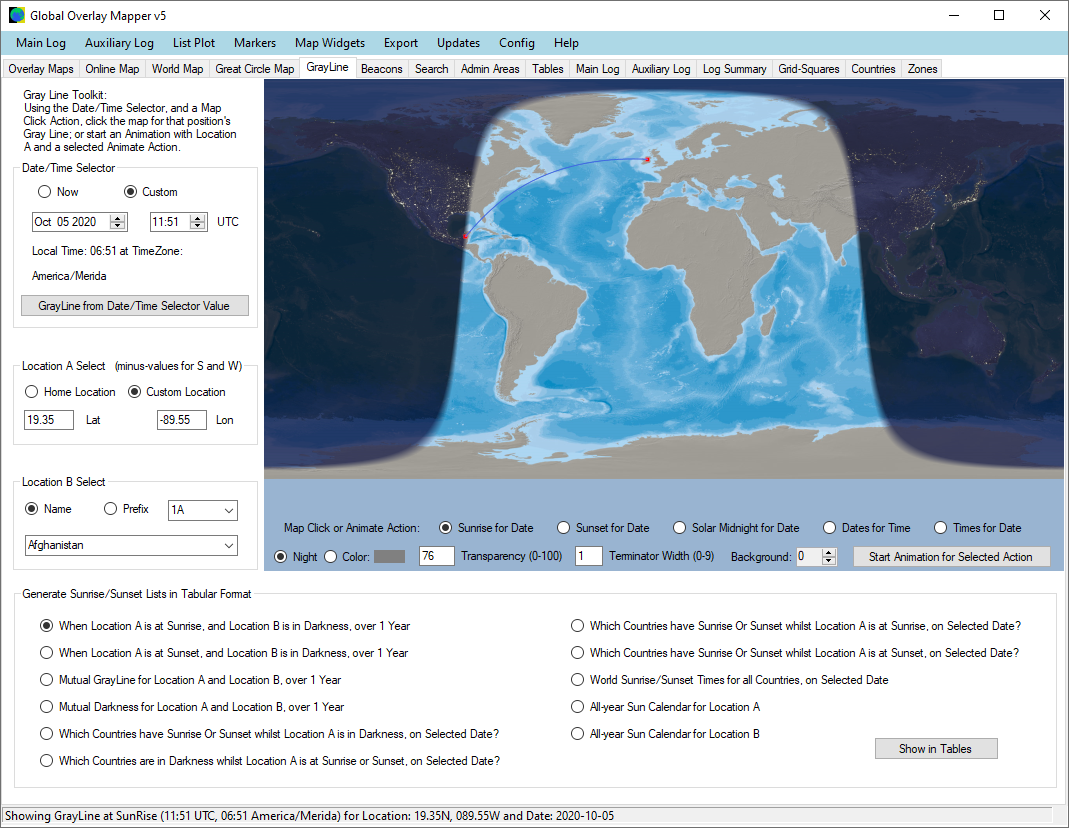
The GrayLine Toolkit is another feature unique to the Global Overlay Mapper. Whilst many other programs show part of the information contained here, none provide so many facilities. Click the map to show the Sunrise curve for that position and date. The route to your home location is included. Do the same for Sunset or Solar Midnight. Animate the map in five different ways. Generate tables that list answers to some complex questions relating to your home location and selectable DX locations. |
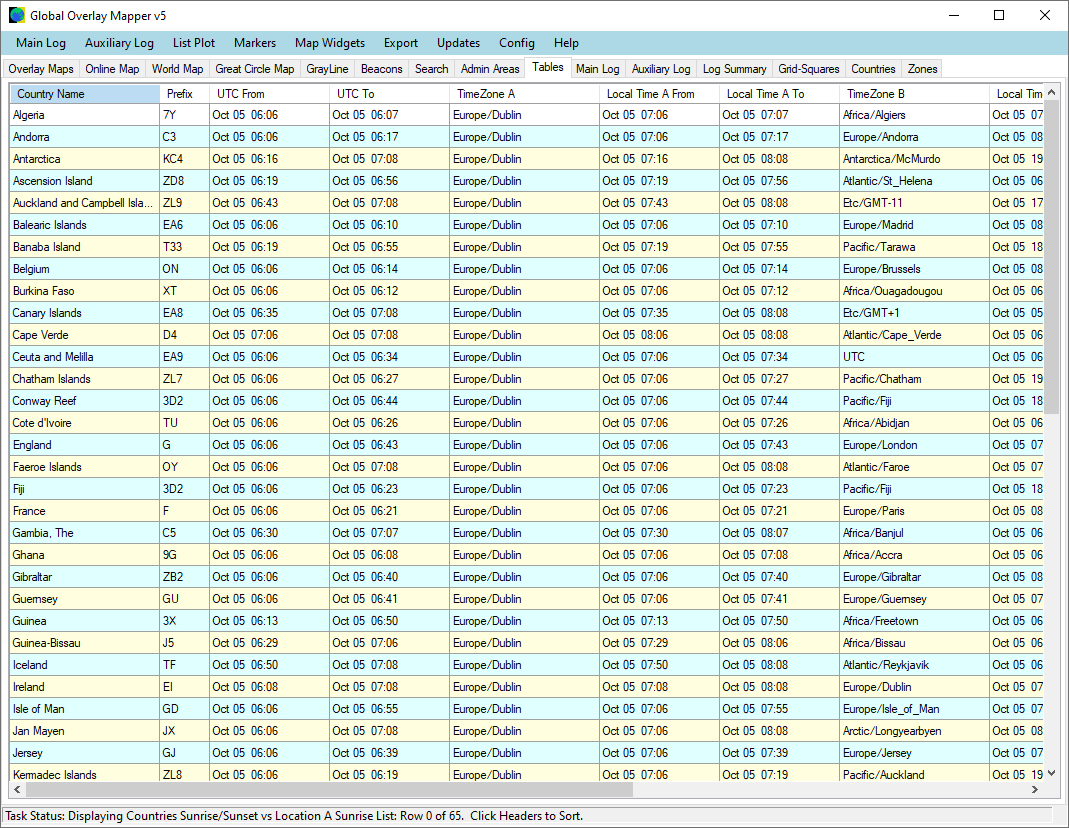
An example of the type of tables that the GrayLine Toolkit can provide. There are 11 different questions answered: 01/ When Location A is at Sunrise, and Location B is in Darkness, over 1 Year. 02/ When Location A is at Sunset, and Location B is in Darkness, over 1 Year. 03/ Mutual GrayLine for Location A and Location B, over 1 Year. 04/ Mutual Darkness for Location A and Location B, over 1 Year. 05/ Which Countries have Sunrise Or Sunset whilst Location A is in Darkness, on Selected Date? 06/ Which Countries are in Darkness whilst Location A is at Sunrise or Sunset, on Selected Date? 07/ Which Countries have Sunrise Or Sunset whilst Location A is at Sunrise, on Selected Date? 08/ Which Countries have Sunrise Or Sunset whilst Location A is at Sunset, on Selected Date? 09/ World Sunrise/Sunset Times for all Countries, on Selected Date. 10/ All-year Sun Calendar for Location A. 11/ All-year Sun Calendar for Location B. |
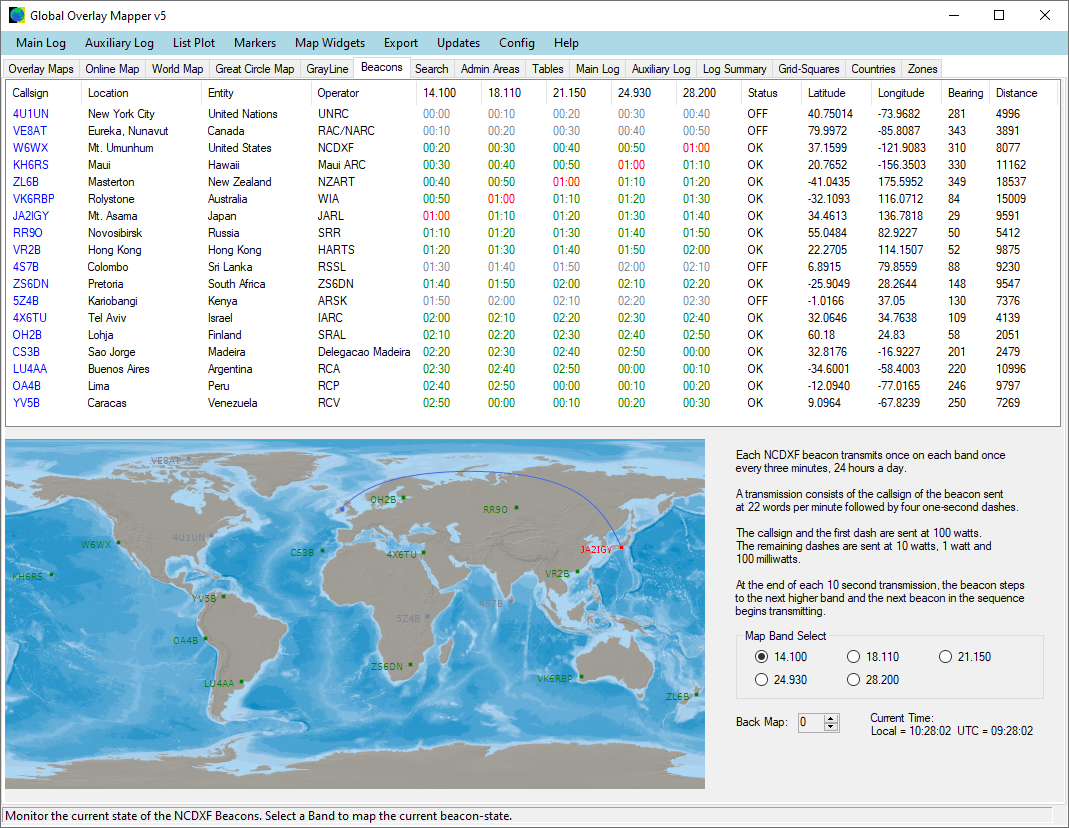
The Beacon Map page shows the current status of all NCDXF HF beacons. It checks online to get the current operational status, then shows which are transmitting on which band, during each 10 second segment. Bearing and distance to your home QTH are provided. Beacon locations are also shown through an overlay on the World Map tabpage. |
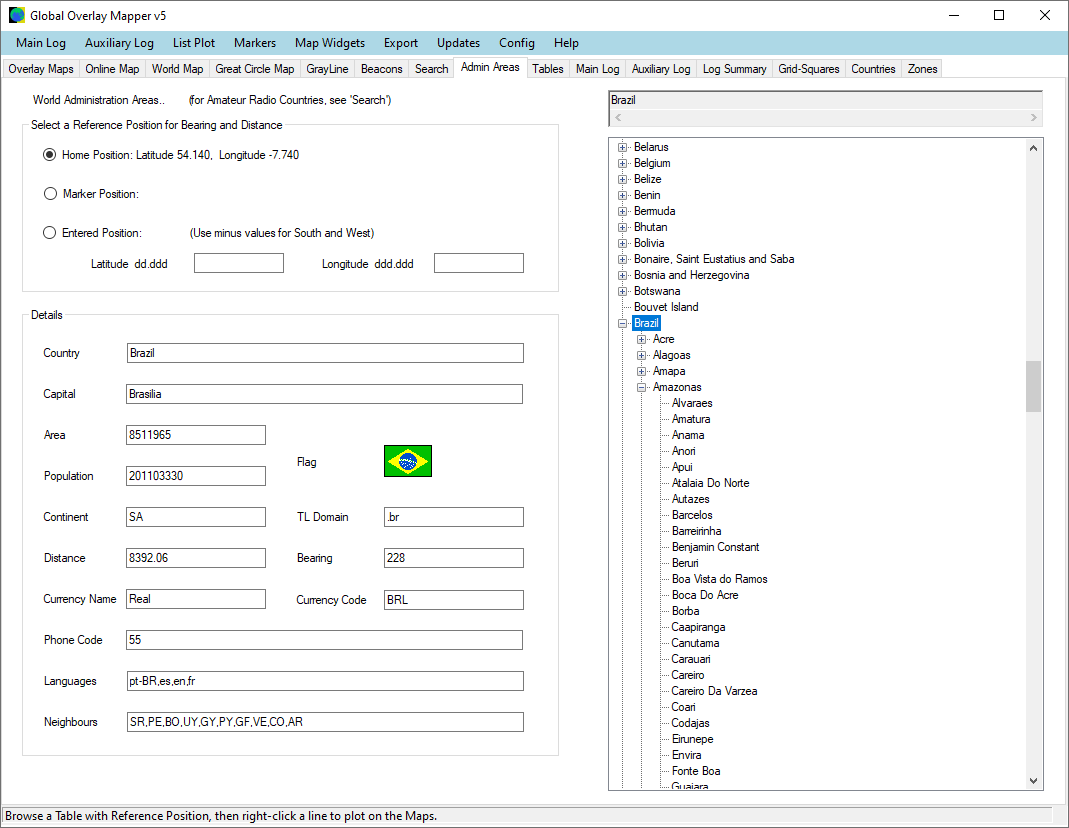
The Admin Areas tabpage provides browse facilities for a large database of over 356,000 'Real World' administration areas, by using a tree-view control. Click a country-name to show more information in the panel on the left. Right-click a name to place a marker on the 4 main maps, or list all of the cities within that node that have a population greater than 5000. Click the '+' sign to expand the node on a number of levels, and gain more information about each of the sub-nodes, or place a node marker on the 4 main maps. |
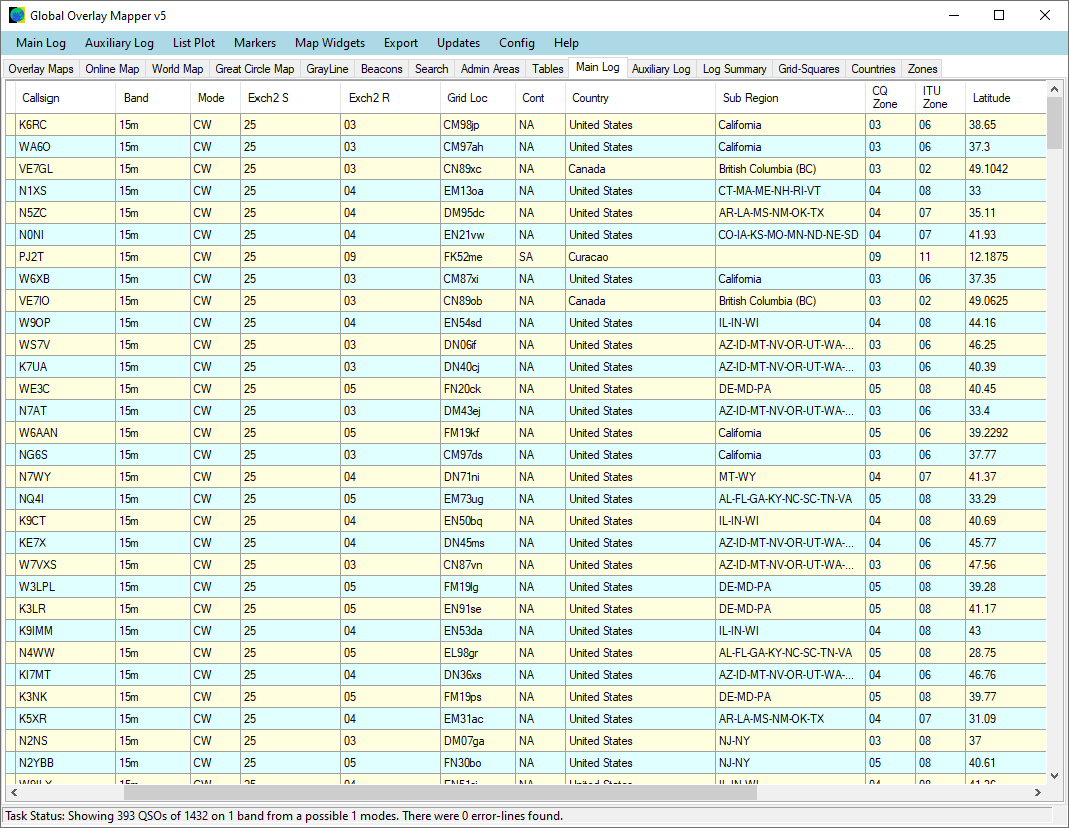
The Global Overlay Mapper can import ADIF or Cabrillo logs to two separate internal databases. Logs have each callsign parsed to identify a number of features, can be geocoded from the HamQTH online database, and have missing Grid Locators generated from the Lat/Lon position. You can export Cabrillo logs in ADIF or CSV format. |
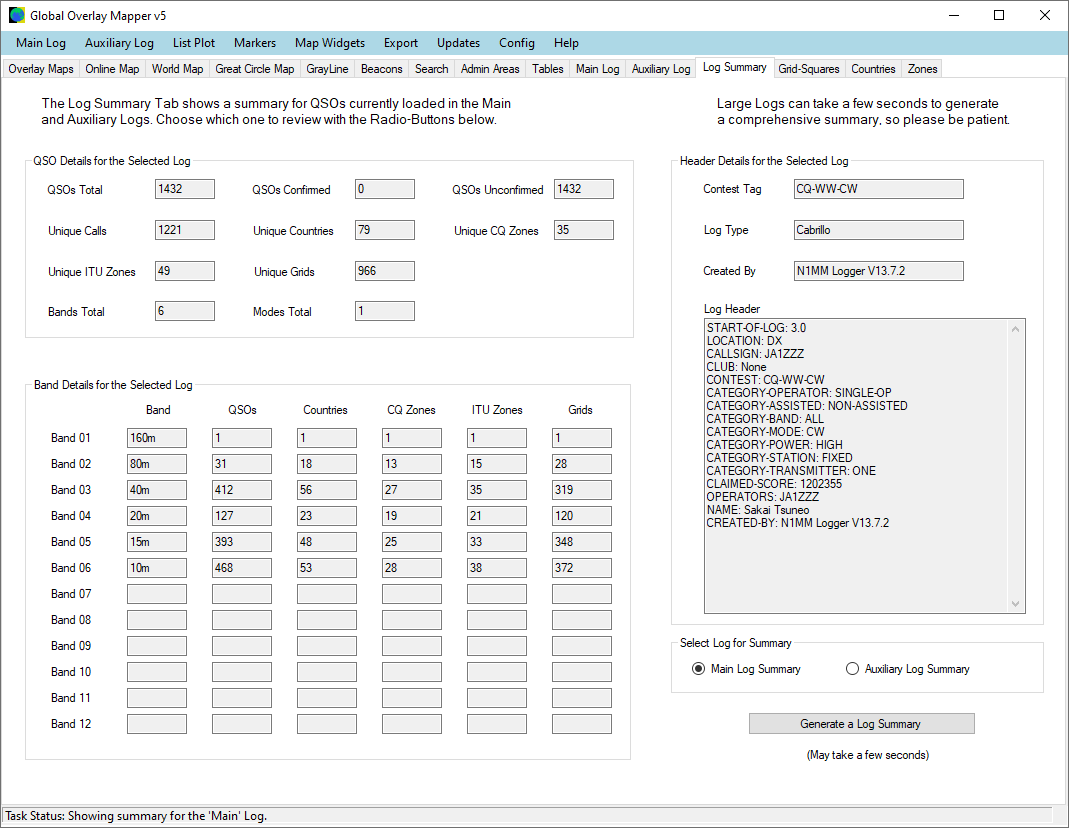
You can generate a very comprehensive summary for the two internal logs, showing unique callsigns, countries, grid locators, CQ and ITU zones, which are then listed in their own tab pages. |
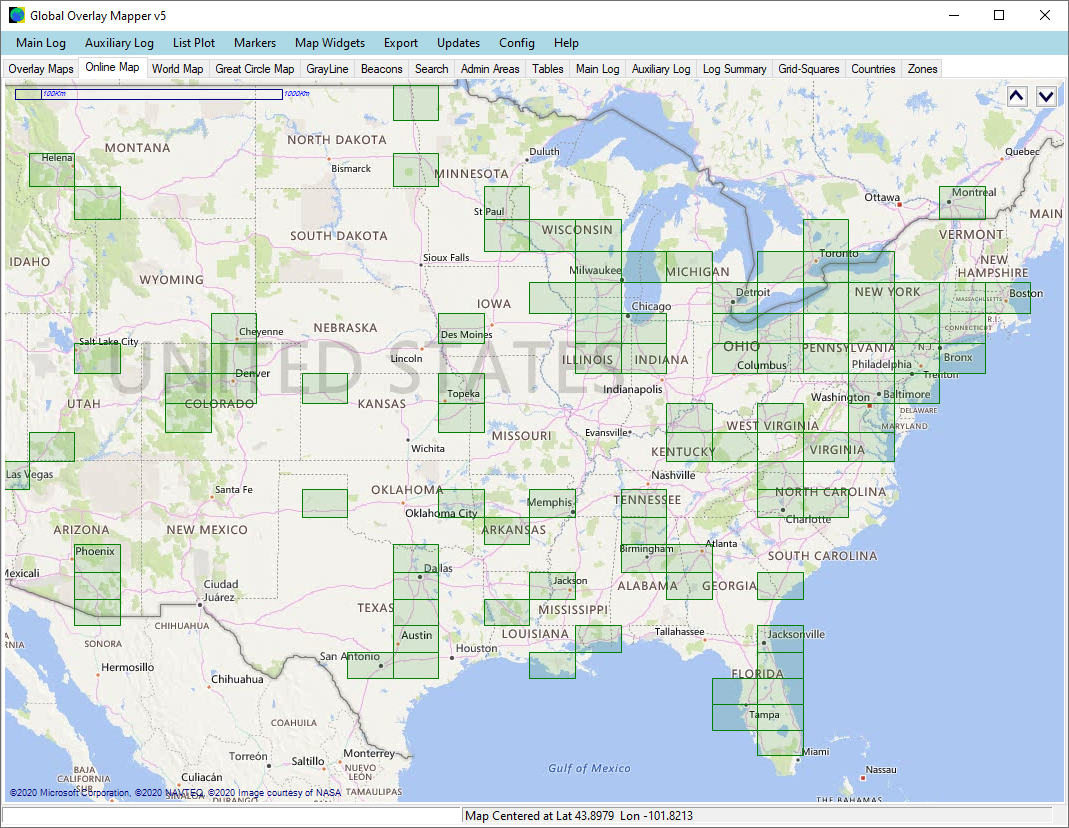
You can plot all the Grid Locators in an ADIF or Cabrillo log. |
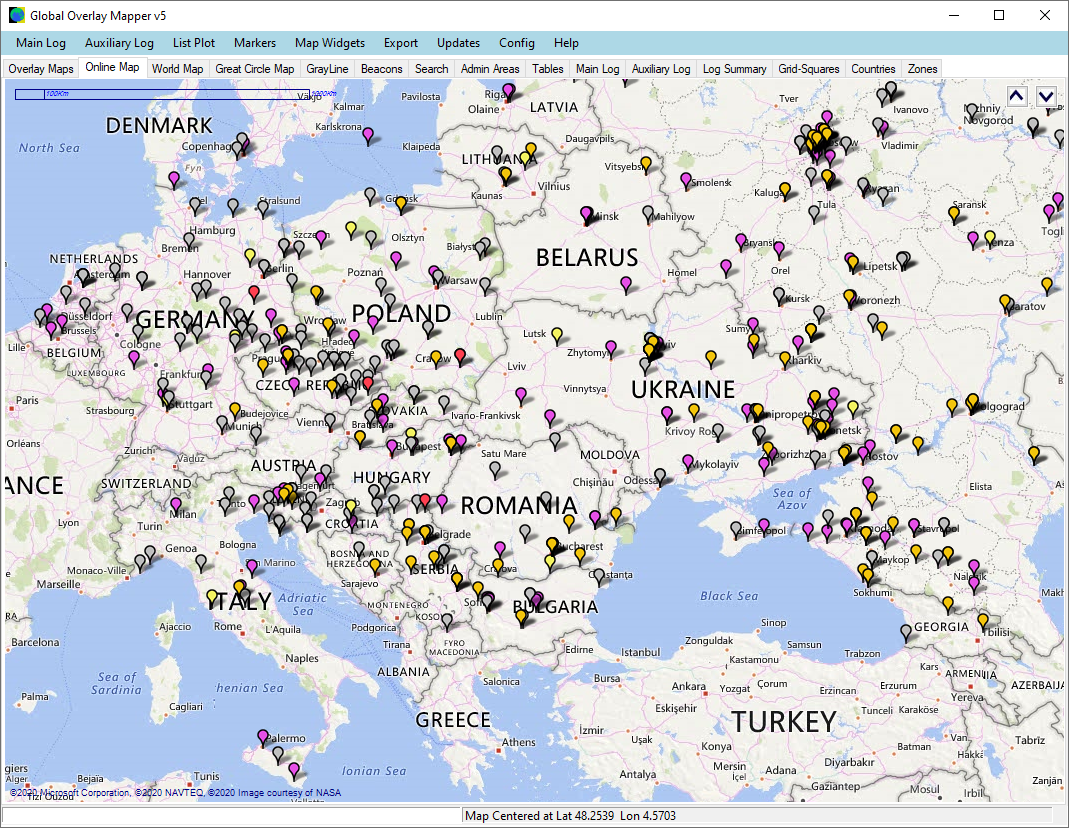
You can also plot all the QSOs in a log, with separate marker-types for all bands or all modes. Each marker used can be chosen from 37 included markers. |
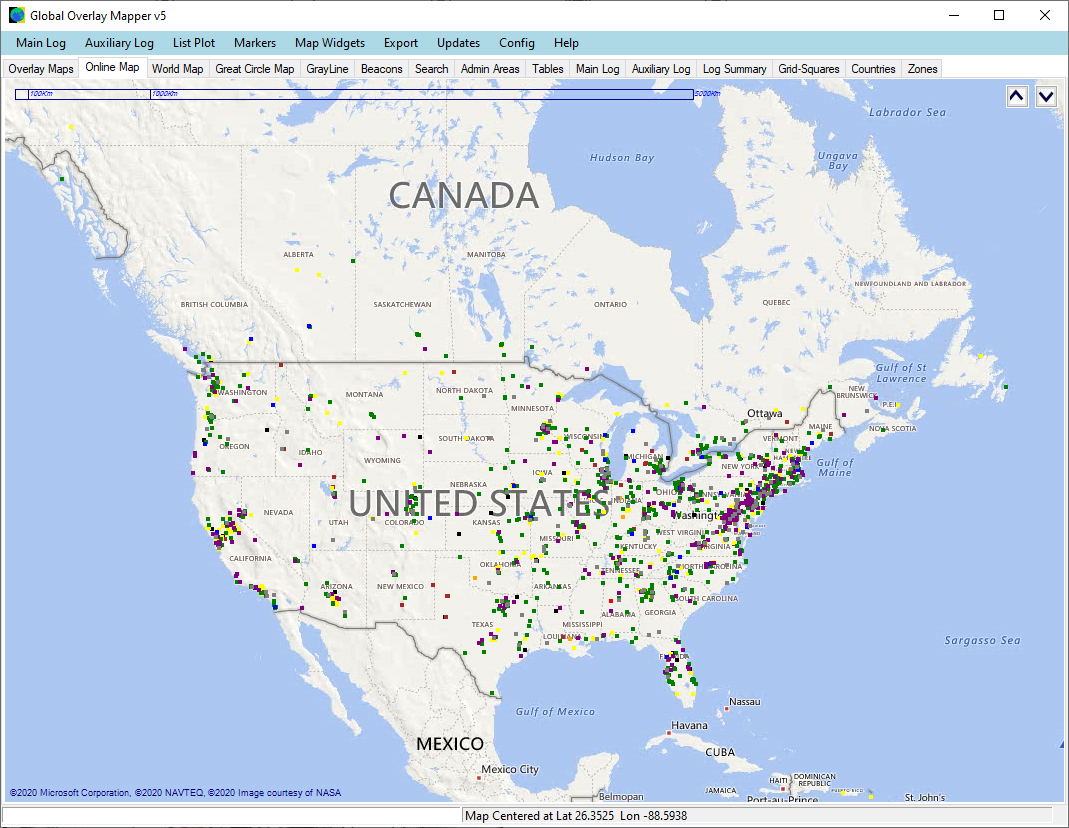
This map shows a list of callsigns that has been imported and plotted on the maps as tiny 'box markers'. This is very suitable for large lists, such as this list of 2019 ARRL Sweepstakes entries. The different colors are used to show the different categories: in this case for power and entry-type. You can load a list with many categories, but choose to plot a subset of them. |
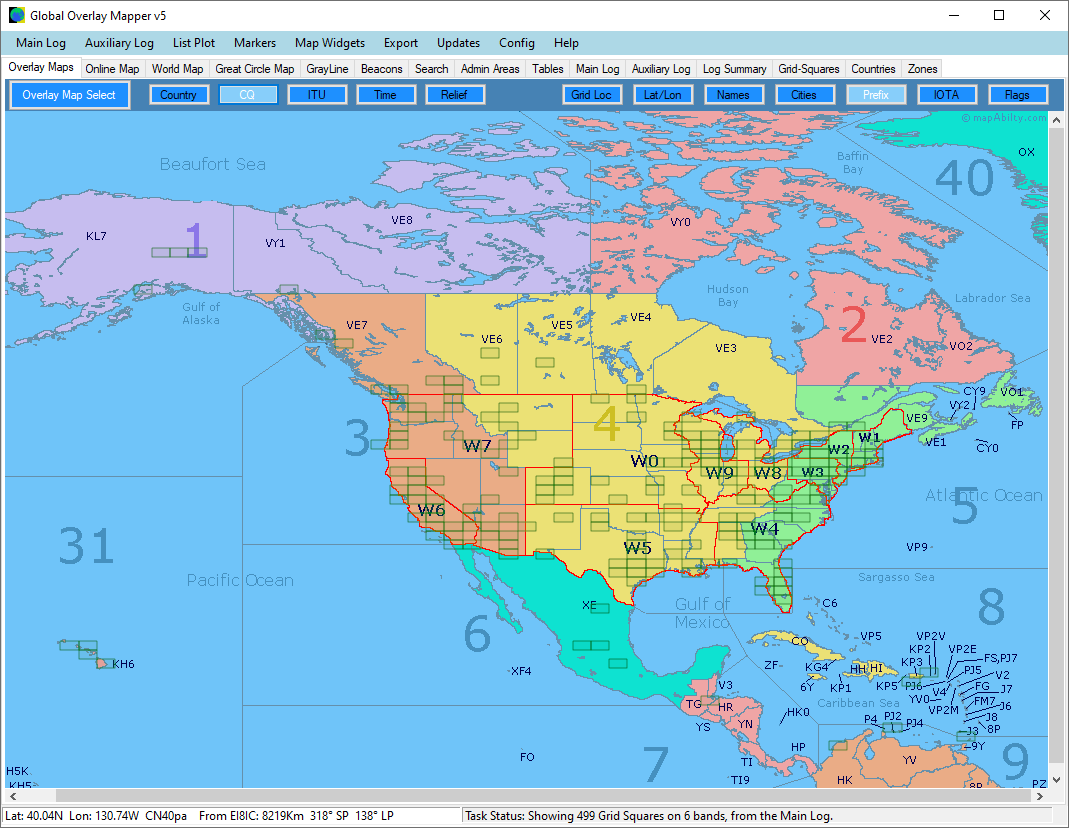
All 37 maps from earlier versions of the Global Overlay Mapper are included, but now they have the same plotting facilities as the Online, World, and Great Circle Maps. Here we see the Grid Locators in the Main Log plotted over the continental map of North America. Mouseover a grid to identify it, or turn on the 'Grid Loc' overlay, or see the continuous position update on the Status Bar. |
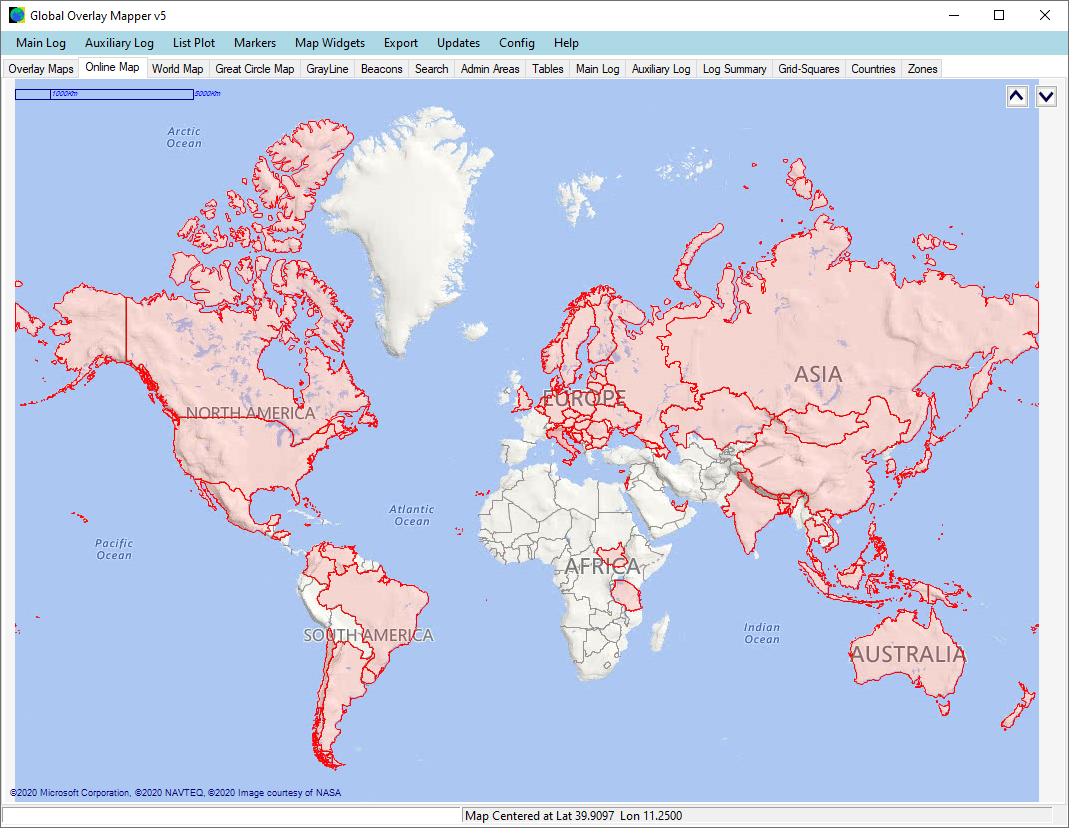
You can plot all of the countries that a log contains. Alternatively, make maps that show all CQ Zones in a log, or all ITU zones in a log. You can also make a map that shows a subset of that list: by band or by mode. |
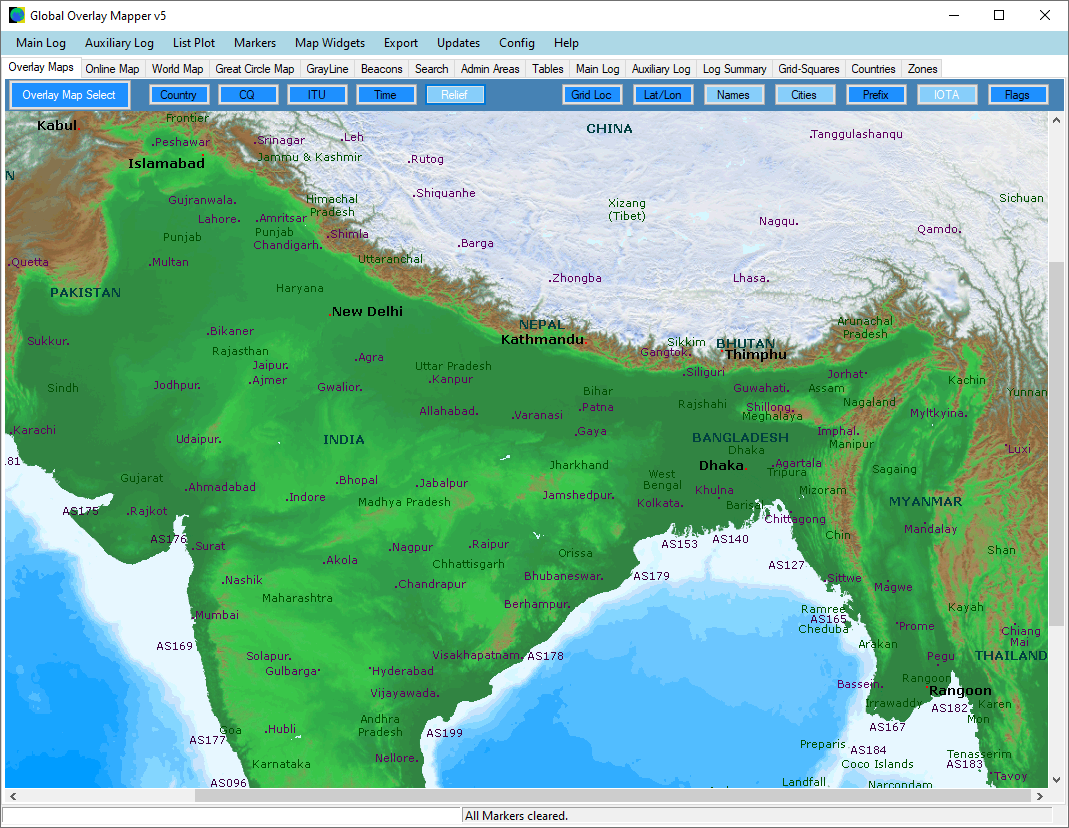
The Overlay Maps all have five different background overlays, and 7 different foreground overlays. Only one background overlay can be on at a time, but you can have as many different foreground overlays as you wish. Other map markers and polygons will be plotted on top of that. They can be cleared or hidden as required. |
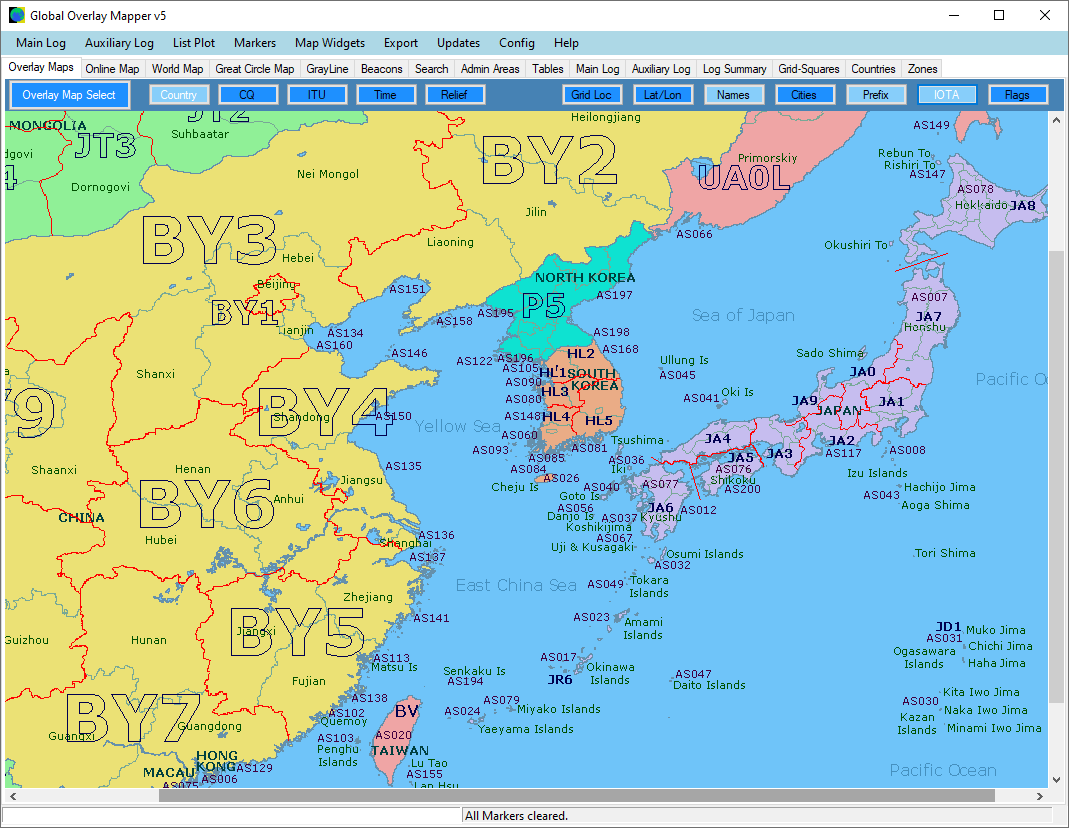
Overlay Mapping allows a lot of information to be fitted on a small screen at one time. Here we see a map of East Asia, with the background 'Country' layer, and 3 foreground overlays: Admin Names, Amateur Radio Prefixes, and IOTA points. |
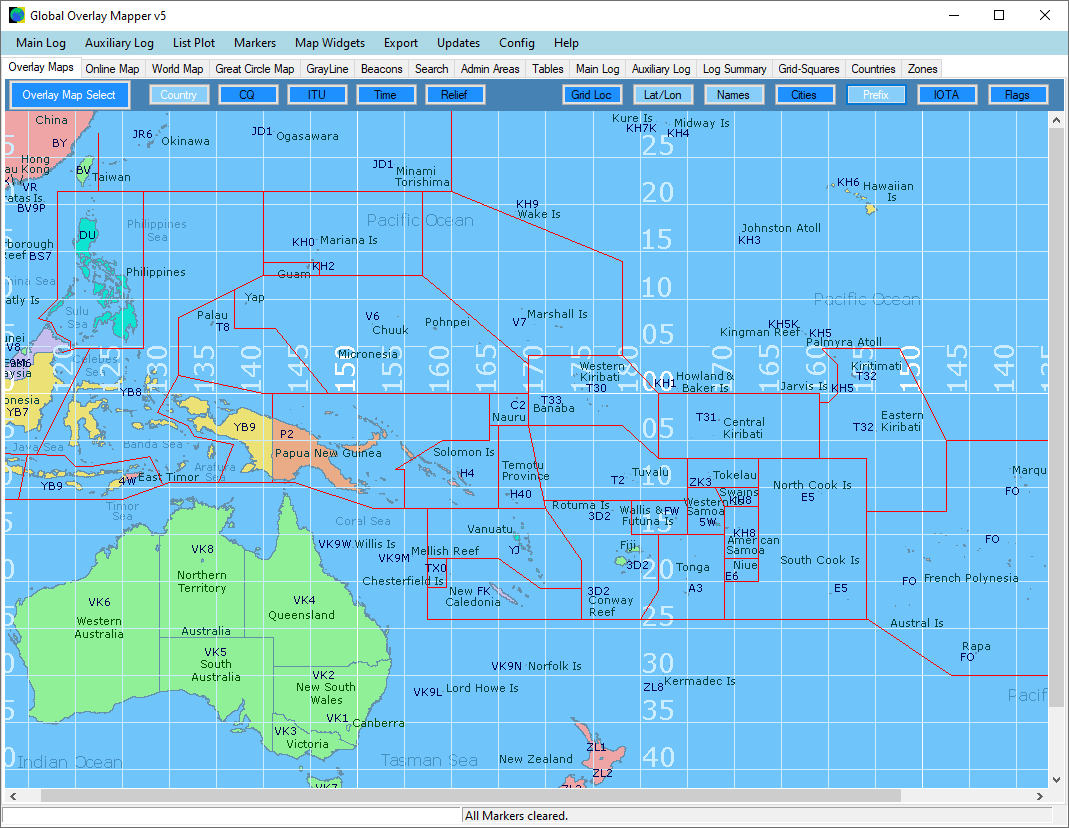
An Overlay map of the Pacific. Three additional sub-continental Pacific maps are available. |