Here are some re-sized screenshots of the 'CPT Designer' in action. Click any image to show that full sized image in a new browser-tab..
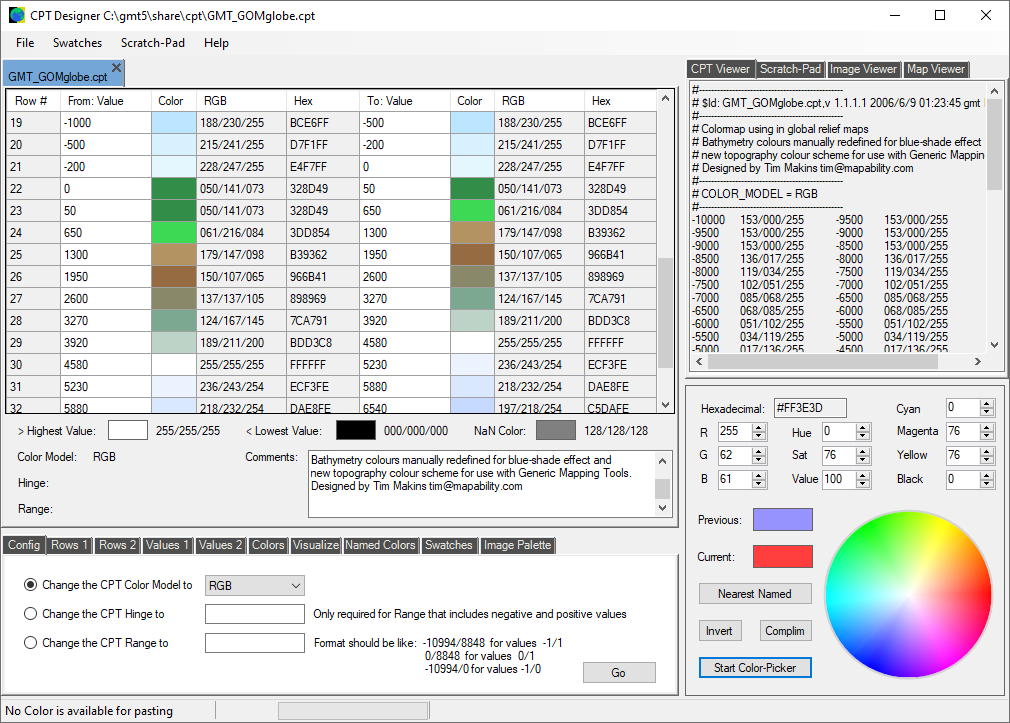
Here is the main program-window for the 'CPT Designer'. We have opened a .cpt file called 'GMT_GOMglobe.cpt. Its text can be seen in the 'CPT Viewer' panel on the right, and the parsed contents can be seen in the main working area on the left, where we can edit the values and colors without worrying about the formatting. The Color Model for this file is RGB.
|
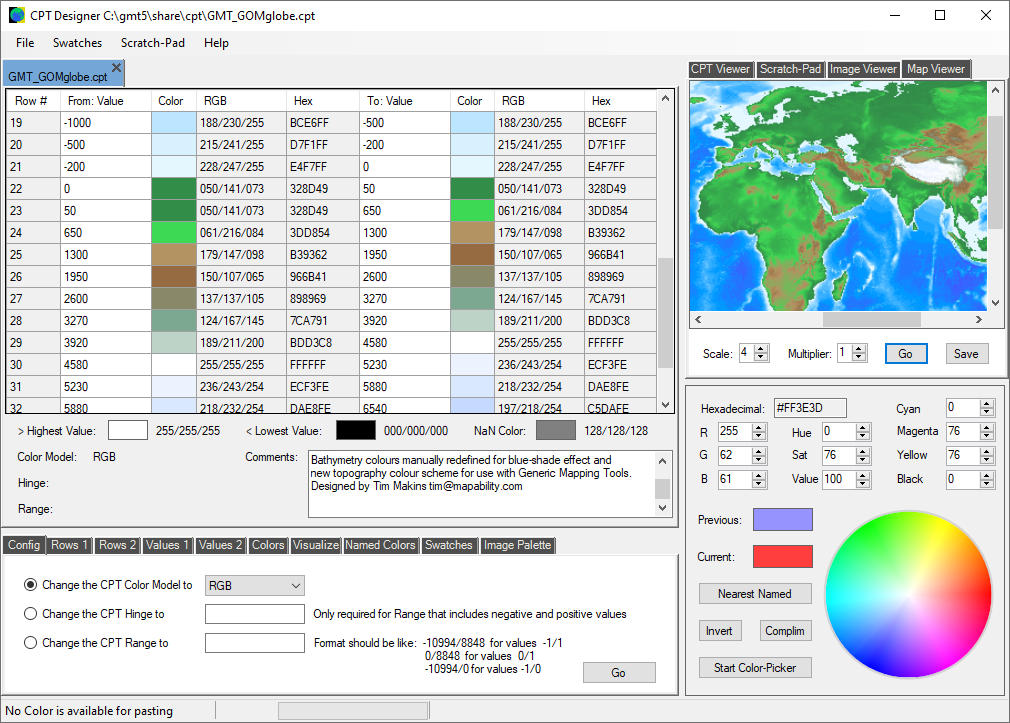
The 'CPT Designer' uses a number of datasets derived from ETOPO to instantly visualize the current .cpt file as a world map. You do not need to save the file in advance. Colors can be easily copied and pasted to any value row, and the resulting map can be saved with your .cpt file as a useful reference and archival tool.
|
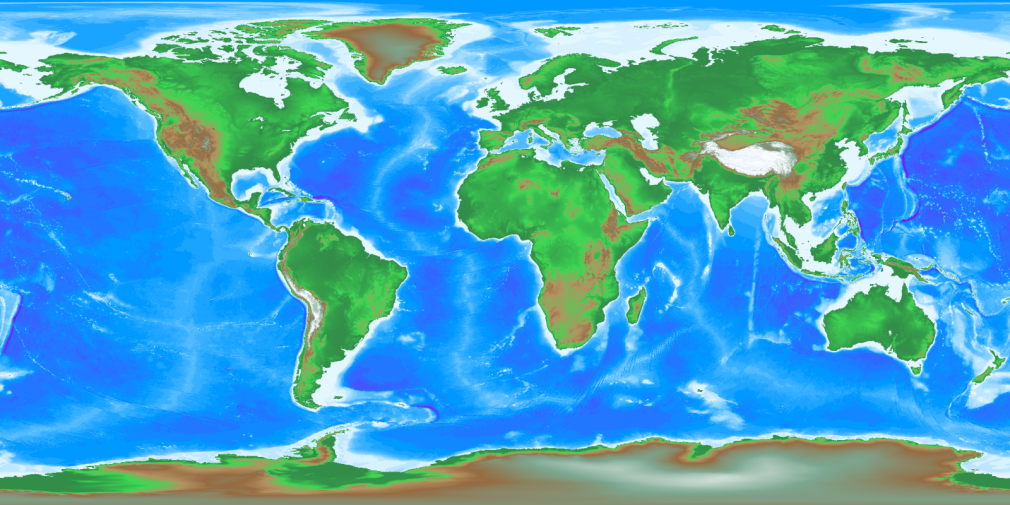
Here is an example of an exported map that was created in seconds from a .cpt file. You can save maps in a variety of resolutions, sizes, and image formats. See more maps created by the 'CPT Designer' on the 'World Map Gallery' page.
|
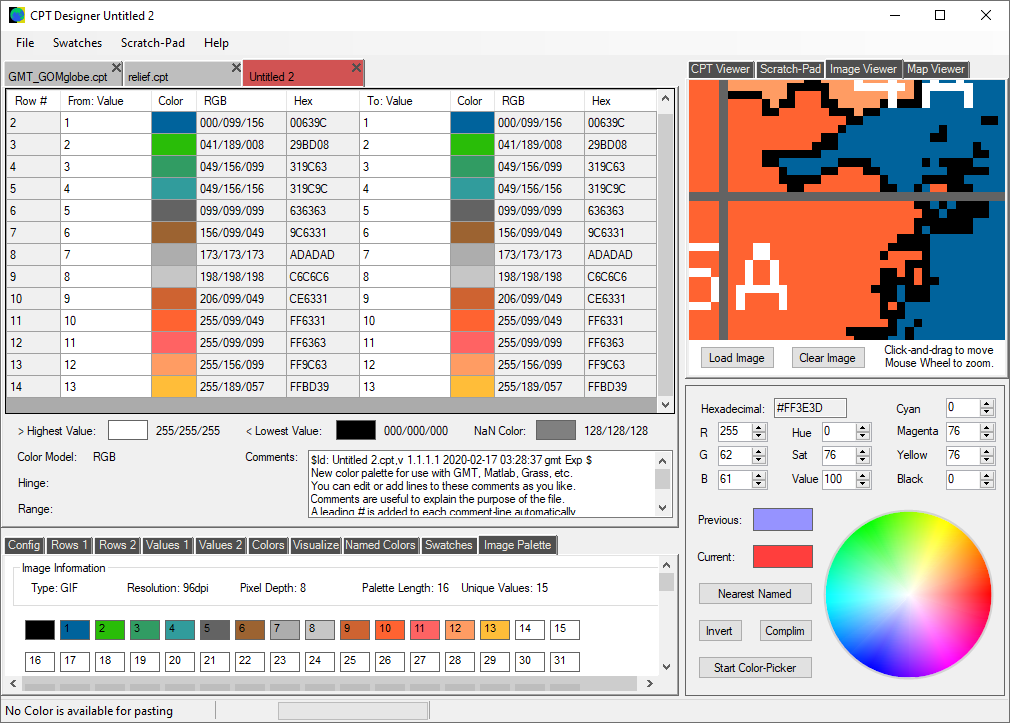
The 'CPT Designer' has its own Image Viewer. We can load most image-types, pan and zoom to pixel-level, and then copy and paste the colors for use in our own CPT files. If the image has its own color-palette, the palette is extracted and displayed in the 'Image Palette' tool-tab-page, as you can see at the bottom of the window.
|
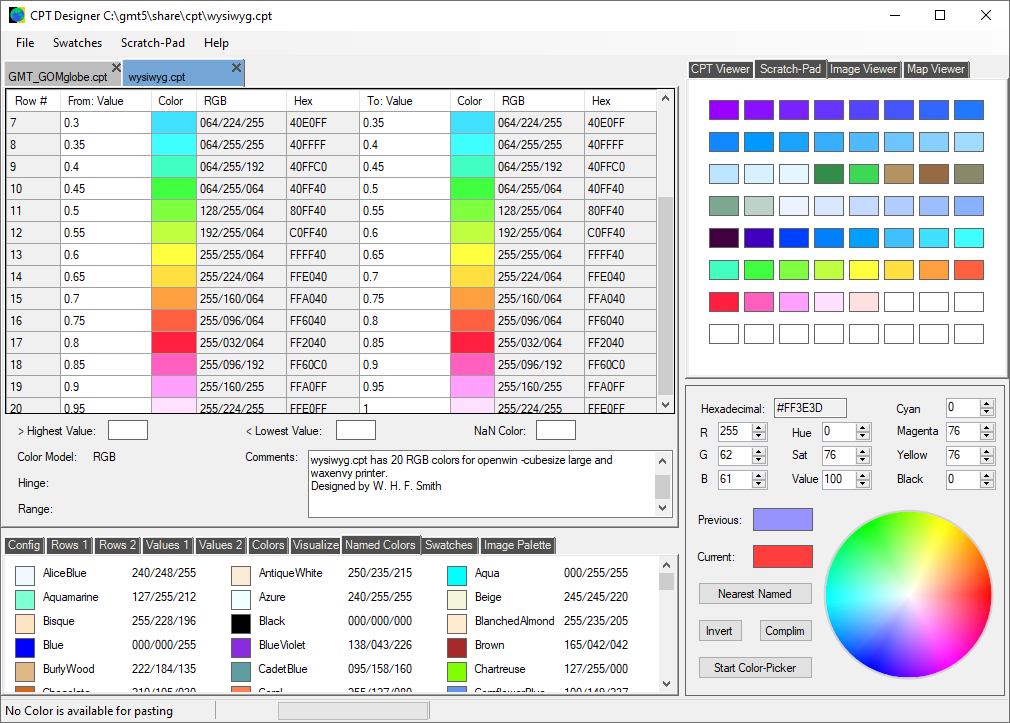
The 'CPT Designer' has a useful color-holding area called the 'Scratch-Pad'. We can extract all unique colors from .cpt file with a single click, and then order them by hue, saturation, or brightness. The built-in Color Picker will grab colors from anywhere on the desktop. A Color Wheel and the page of all Named Colors provide access to many more colors that you can use when creating or editing CPT files.
|
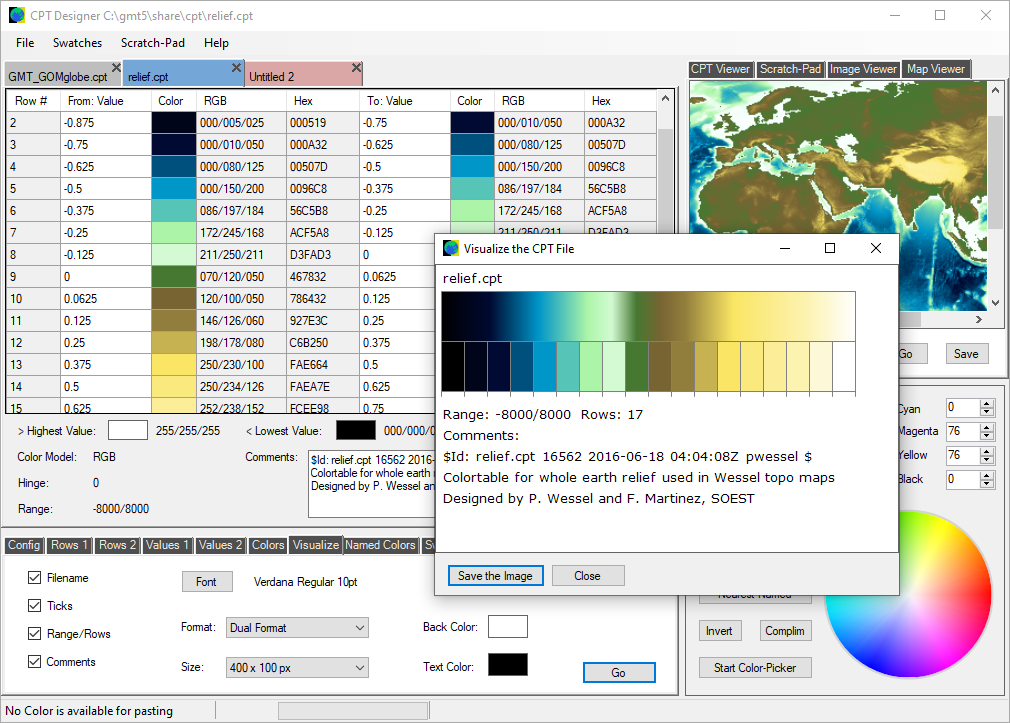
Here is another example of a .cpt file that has been loaded into the working area, and turned into a map for useful referencing and archival purposes. Notice that the color palette file has been normalized, but the mapping routine picks up the Range values before processing the elevation data. A popular way to keep an easy-to-access reference to a color palette file is to create a small image of the colors involved. The 'CPT Designer' can visualize the file in a number of ways, and add optional data to the image as well: filename, range, row count, comments, etc.
|
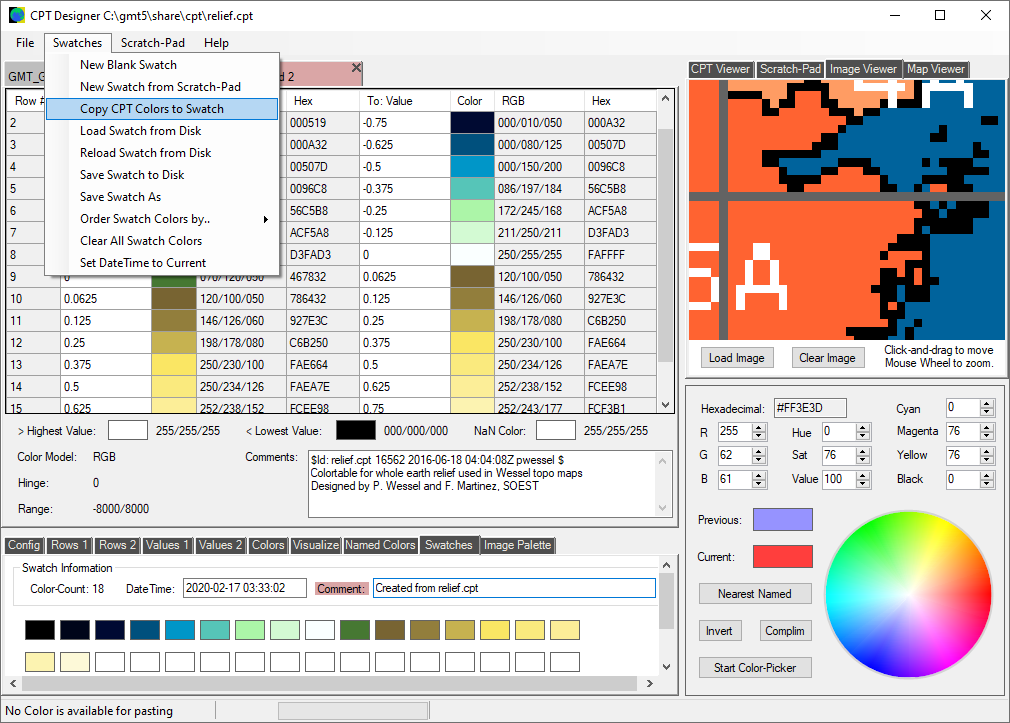
The 'CPT Designer' can create and read small files of 64 colors called 'Swatches'. These are useful when creating your own color-palette files. Swatches can be filled from the CPT File or Scratch-Pad, and color-sorted by hue, saturation, or brightness. Each Swatch can include a creation date/time, and optional comments.
|

Most of the work of creating and editing color palette files is done from the Tool Tab-Pages, at the bottom of the program window. Here are some screen shots of a few of them, with explanation of their functions. The first tab is the 'Config' page, which contains commands to set or change the Color Model, the Hinge, and the Range. The Color Model defines how the colors in the CPT file are specified: RGB, HSV, or CMYK. The Hinge marks the Value where a range changes from negative to positive. It is usually '0', but can be set to any value within the Range. It is used to treat the two halves of the CPT file differently when normalizing to fit the User's range. The Range is often present when the Values have been Normalized, and is required if the values need to be compared to a Denormalized data-set.
|

The 'Rows 1' page contains commands to insert and delete rows in the current CPT File:
- Insert xx New Rows after Row aa
We choose the desired number of rows with the 'Quantity xx' control, and choose the Row number where we would like them to be inserted with the 'Row aa' control. The desired number of rows will be inserted after the existing row at the position specified. The inserted rows are all the standard 'Empty Row' that is used when a new CPT file is created. You can enter the Values and Colors directly, or use the numerous tools in the Tools tab-pages to change or create value and color gradients.
- Insert New Rows every yy Metres, or Fraction, between the Start & End values in Row aa
Although you can add empty Rows and then create a gradient of their values with tools in the 'Values 1' tab-page, it is often convenient to combine adding and gradient-creation in one command. This tool does exactly that, by using the 'From' and 'To' values in a chosen row to set the start and end values of a gradient that has steps equal to the value entered in the adjacent box. Imagine a row that currently has a 'From' value of '-1000' and a 'To' value of '-500'. If you use a value of '100' and click 'Go', the original row will be replaced by five rows, with From/To values of -1000/-900, -900/-800, -800/-700, -700/-600, and -600/-500.
- Delete xx Rows, Starting at Row aa
This command is fairly straight forward: just choose the number of rows that you wish to delete with the 'Quantity xx' control, and choose the first row that will be deleted with the 'Row aa' control. Click 'Go', and the desired number of rows will be deleted.
|

The 'Rows 2' page contains commands to Cut, Copy, and Paste rows in the current CPT file. Rows that have been Cut or Copied are stored in the program Clipboard, and can then be Pasted either to the same CPT file, or to a different CPT file in another tab-page of the CPT File Window. You can choose the number of rows to Copy or Cut with the 'Quantity xx' control. Once in the program Clipboard, the number of rows is indicated in the text adjacent to the 'Paste' radio-button. Rows in the Clipboard can be used for multiple 'Paste' operations. Pasting will insert the rows stored in the program Clipboard after the current contents of the chosen row, leaving the current chosen row unchanged.
|

The 'Values 1' page in the Tools tab-pages contains commands that operate on the Values in the rows of the current CPT File. The commands are:
- Apply Values in 'Range' and 'Hinge' to Normalized Table-Values
This command will convert 'Normalized' values to metre or feet values. It requires that the CPT file Values have already been 'Normalized' - in other words, that all the Values are in the ranges: [-1,0] or [0,1] or [-1,1]. In addition, it requires that the 'Range' value, located at the bottom of the current CPT file in the CPT File Window has a valid metre or feet value. If that Range value crosses zero, then a 'Hinge' value is also used, though if one is not present, a Hinge of '0' will be assumed. You can change the Hinge value to any value present in a cell in the 'From: Value' column by using the command on the 'Tools > Config' tool-page.
- Normalize the Table-Values by converting Metre Values to [0,1]
This command will convert 'Denormalized' values (i.e. values that are outside the range: [-1,1]) to the ranges: [-1,0] or [0,1] or [-1,1]. It requires that the CPT file Values are currently in metres or feet.
If the current range of values crosses zero (i.e. -8000/8000), then a Hinge Point will be needed. The Hinge Point is shown for each CPT File in the box adjacent to 'Hinge:' on the CPT File Window.
- Create Gradient between Row aa & bb using Values xxxx to yyyy
This command will create a gradient in the 'From Value' and 'To Value' columns. Choose the starting row for your gradient with the 'Row aa' control, and the ending row for your gradient with the 'Row bb' control. The values for the start and end of your gradient are obtained from the 'Value xxxx:' and 'Value yyyy:' boxes. The gradient can be either linear or logarithmic, as selected in the 'Gradient-Type' panel.
- Create Gradient between Row aa & bb using aa & bb Row Values
This command will create a gradient in the 'From Value' and 'To Value' columns. The value for the start of your gradient is obtained from the 'From Value' of your starting row. The value for the end of your gradient is obtained from the 'To Value' of your ending row.
|

The 'Values 2' page contains commands that operate on the Values in the rows of the current CPT File. The commands are:
- Alter Values from Row aa to Row bb by performing Add/Subtract/Multiply/Divide with Value: xxxxxx
This command lets you alter a selected range of row-values (both From and To), using the selected method: Add/Subtract/Multiply/Divide, and the value that you have entered in the 'Value:' box.
- Equalize Row Values using Values: Row aa(From) - Row bb(To)
This command uses the 'From Value' in the row that you select with the 'Row aa' control, and the 'To Value' in the row that you select with the 'Row bb' control. It then creates an equal gradient between the two cells, with the step-sizes dependent on the number of steps.
- Check All Rows for Discontinuity within Values
This command checks that the 'To' value on each row is the same as the 'From' value on the next row. It doesn't fix anything: it just tells you where each discontinuity is. Only one discontinuity is reported at a time.
- Round Values from Row aa to Row bb to xx Decimal-Points
Use this command to round the 'From' and 'To' values in the selected rows to a specified number of decimal points. The rounding method used is 'Midpoint-Rounding Away From Zero'.
|

The 'Colors' page contains the following commands:
- Create Sequential Color-Gradient between Row aa and Row bb using Attribute: Hue, Saturation, or Value
This command creates a linear color-gradient between the existing colors in the specified start and end rows. The gradient uses either the Hue, Saturation, or Brightness-values of the start and end colors. The size of the step between each increment is set by the number of rows and the current start and end values. Note that whilst Saturation and Brightness-values operate over a range of 0-100, the Hue operates on a circular range that goes from 0-360 and then carries on from 0 again.
- Flip the Color Range between Row aa and Row bb
This command reverse the colors in the rows between your selected start row and end row. The 'From' color in your start row is swapped with the 'To' color in your end row, etc. etc.
- Match Colors between Row aa and Row bb to a Uniform Attribute-Amount
This command sets the Hue, Saturation, or Brightness-values for the rows that you have selected to an amount specified by the 'Amount' control, whilst leaving the current values of the other color-attributes unchanged.
- Adjust Colors between Row aa and Row bb by Adding/Subtracting the Attribute-Amount (capped at max/min)
This command adjusts the Hue, Saturation, or Brightness-values for the rows that you have selected by Adding or Subtracting an amount specified by the 'Amount' control. The resultant value of the Saturation and Brightness levels is capped at [0,100], but the Hue operates on a circular range that goes from 0-360 and then carries on from 0 again, so adding '100' to a current Hue of '320' will result in a new Hue value of '060'. |


